10.2. Lesson: 役に立つQGISプラグイン
プラグインをインストールして有効化・無効化することができるようになりました。それではいくつかの便利なプラグインの例を見て、これが実際にどのように役に立つか見ていきましょう。
このレッスンの目標: プラグインインターフェイスに慣れ、いくつかの便利なプラグインを使ってみる。
10.2.1.  Follow Along: ラスタ地形解析プラグイン
新しい地図に exercise_data/raster/SRTM の srtm_41_19.tif ラスタデータセットを読み込みます。
ラスタ解析に関するレッスンから、あなたは既にラスタの解析機能を知っています。あなたはGDALツール(ラスタ –> 解析 からアクセス可能)を使用しました。しかし、ラスタ地形解析プラグインについても知っておく方がいいでしょう。これはQGISの新しいバージョンでは標準機能なので個別にインストールする必要はありません。
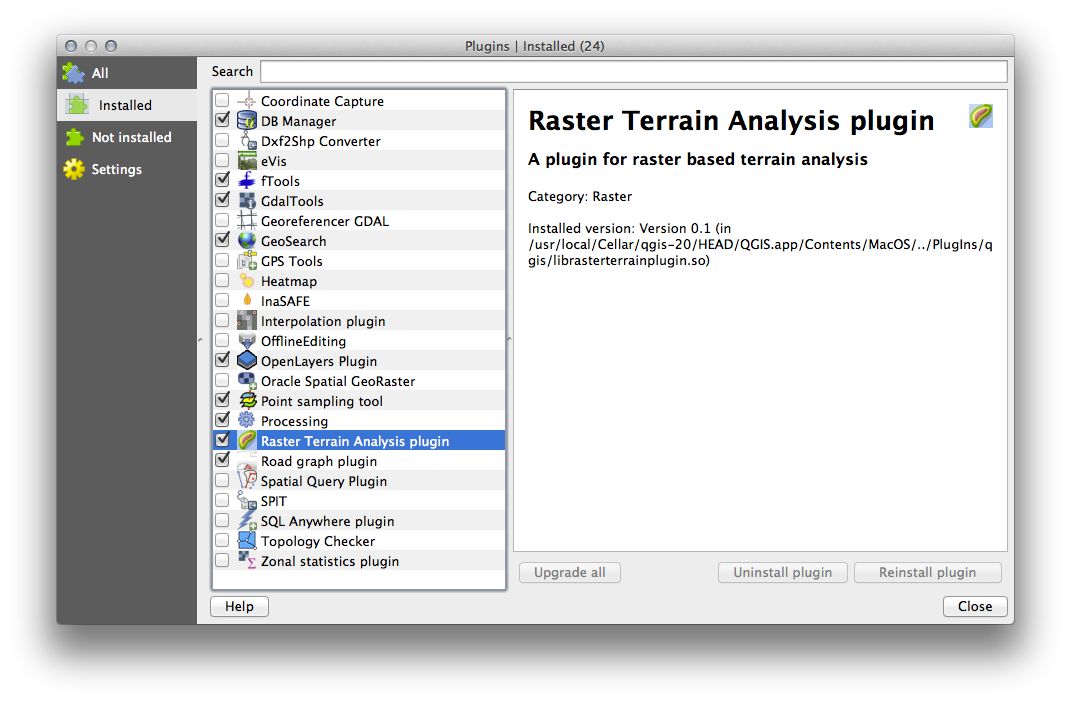
プラグインマネージャ を開き、ラスタ地形解析プラグインが有効になっていることをチェックします。
ラスタ メニューを開くと、 地形解析 サブメニューがあります。
地形解析 ‣ レリーフ をクリックして、次のオプションを入力します:
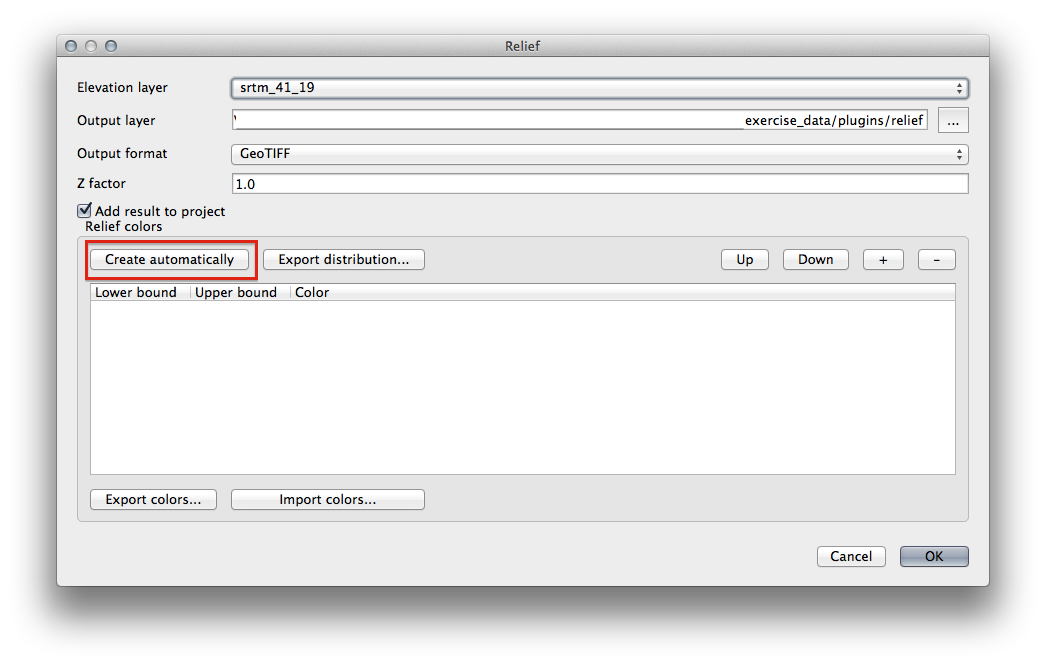
新しいファイルを exercise_data/plugins/relief.tif に保存します (必要なら新しいフォルダを作成します)。
出力形式 と Zファクタ は変更しません。
結果をプロジェクトに追加する ボックスはチェックされていることを確認します。
自動的に作成する ボタンをクリックします。下にリストが作成されます:
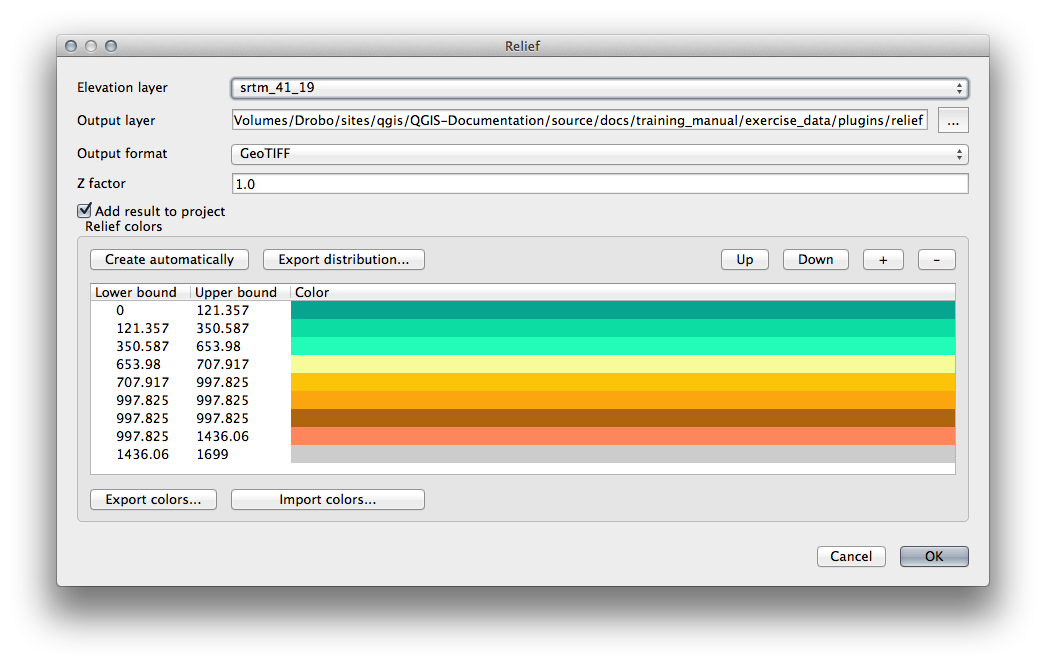
これらはプラグインがレリーフを作成するのに使う色です。
お好みに応じてこれらの色は変更することができます。変更するには各行の色の横棒をダブルクリックします。例えば:
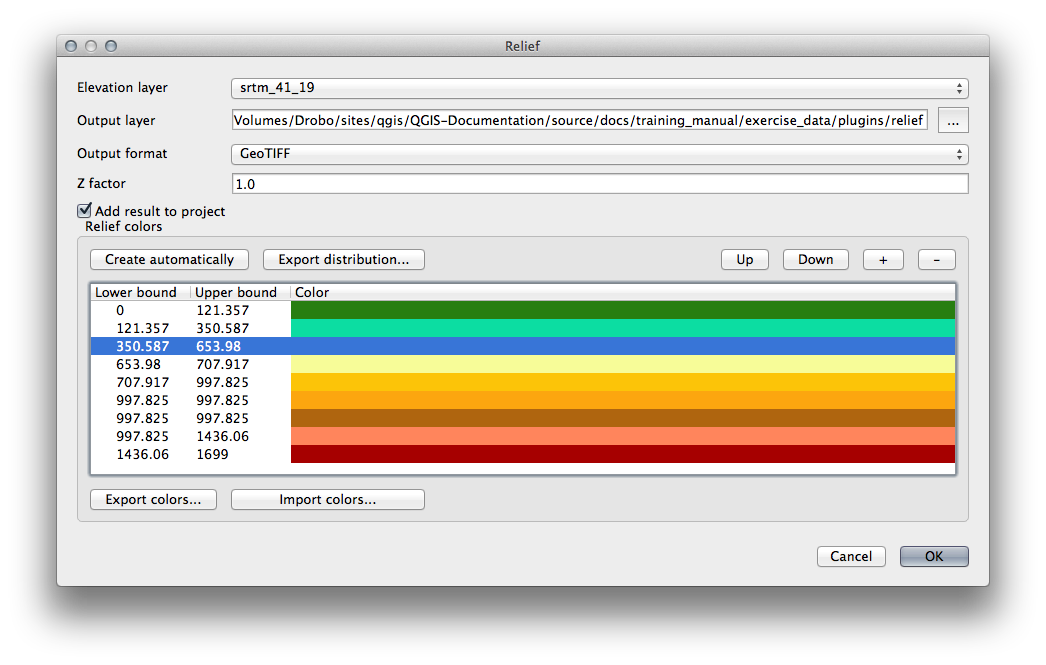
OK を押すとレリーフが作成されます:
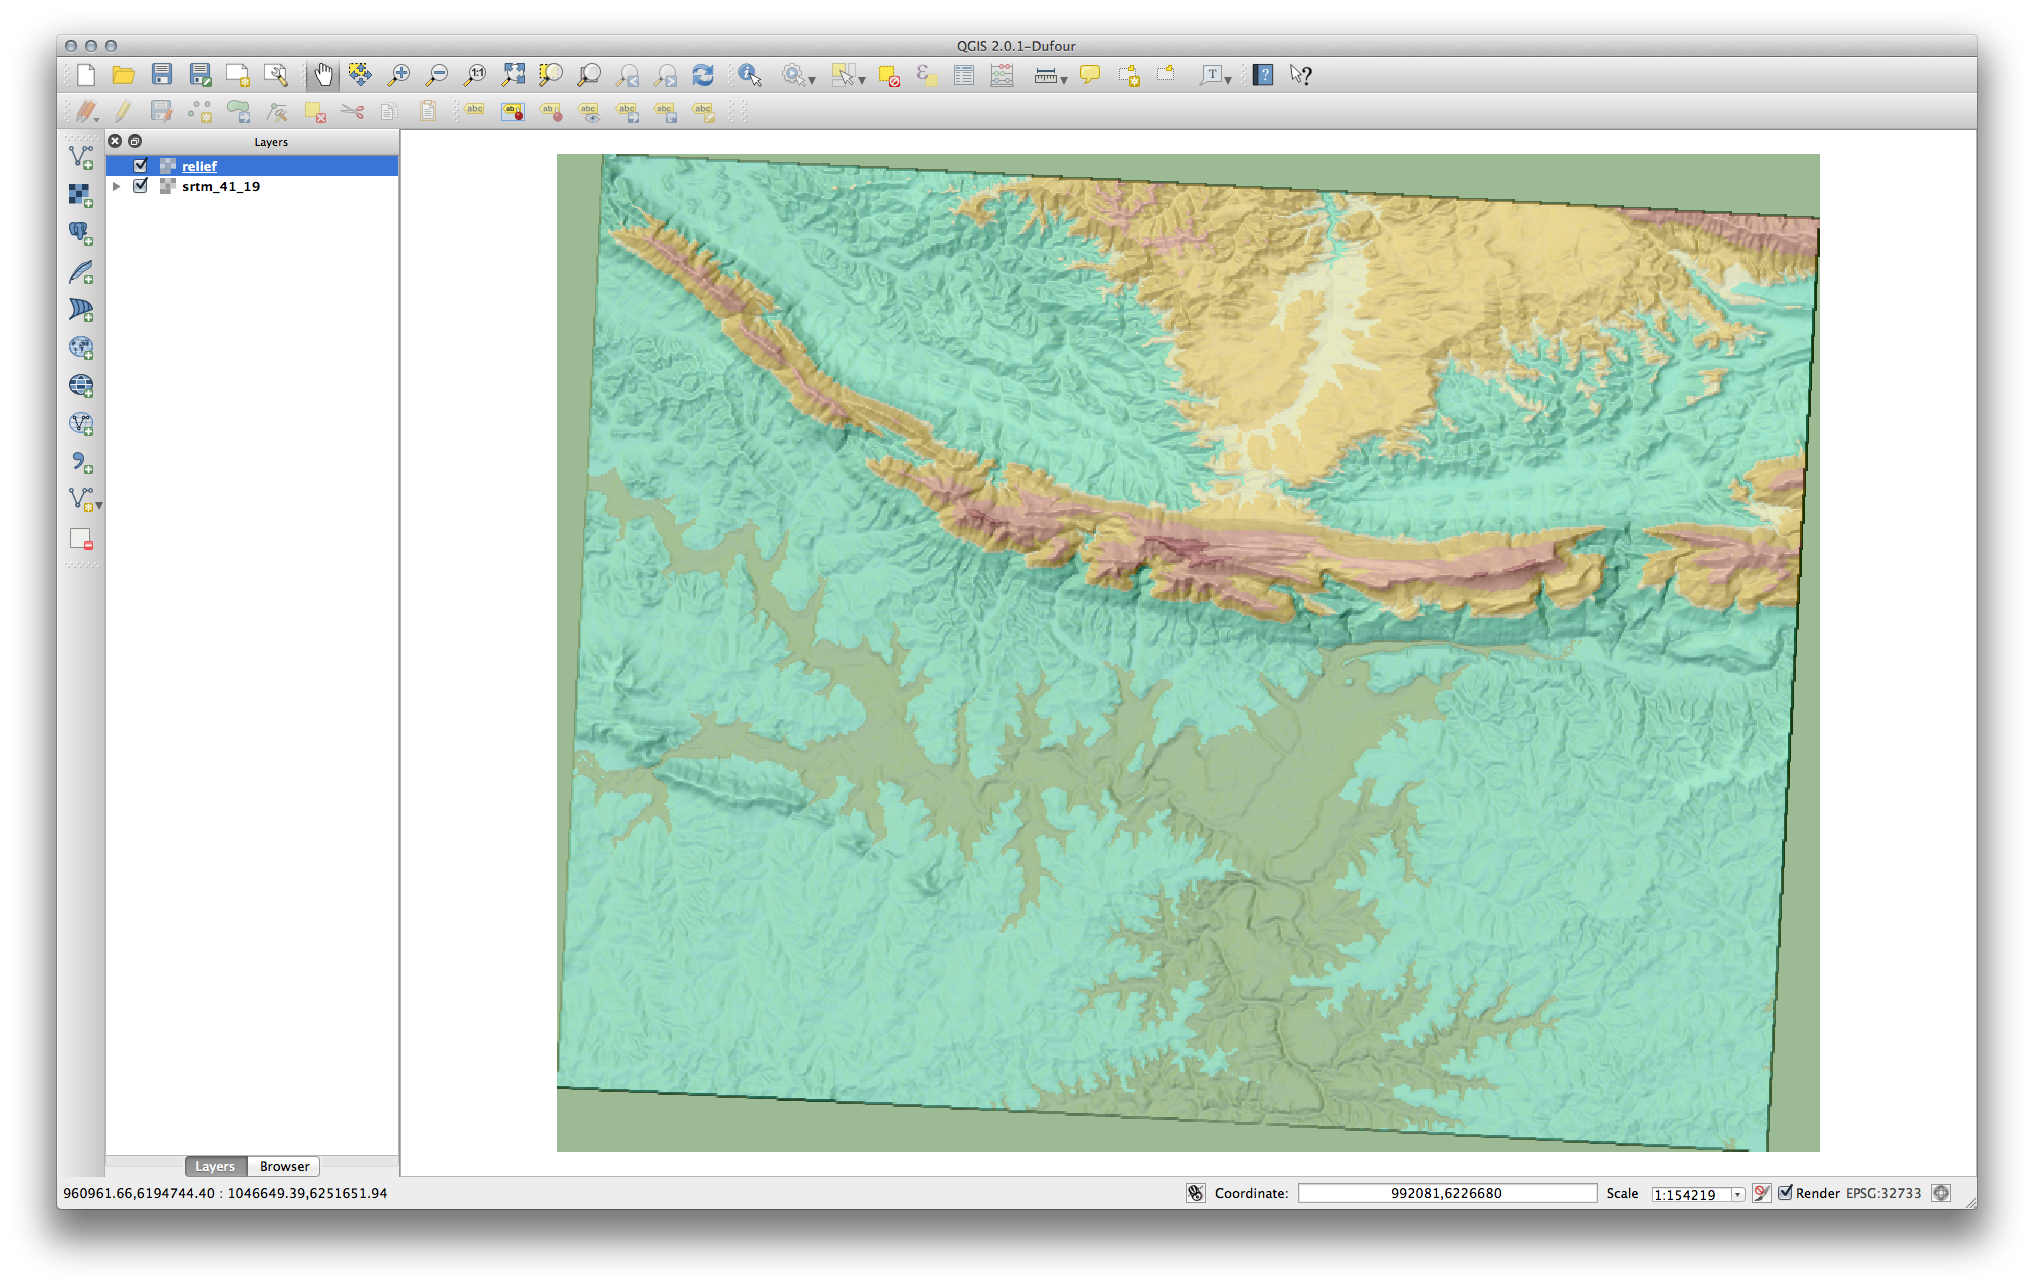
これは他のラスタレイヤの上のオーバーレイとして半透明の陰影図を使用したときと同様の効果を実現しています。このプラグインの利点は、一レイヤのみでこの効果を作成することです。
10.2.2. Follow Along: OpenLayers プラグイン
Start a new map and add the roads.shp layer to it.
Zoom in over the Swellendam area.
Using the Plugin Manager, find a new plugin by entering the word OpenLayers in the Filter field.
Select the OpenLayers plugin from the filtered list:
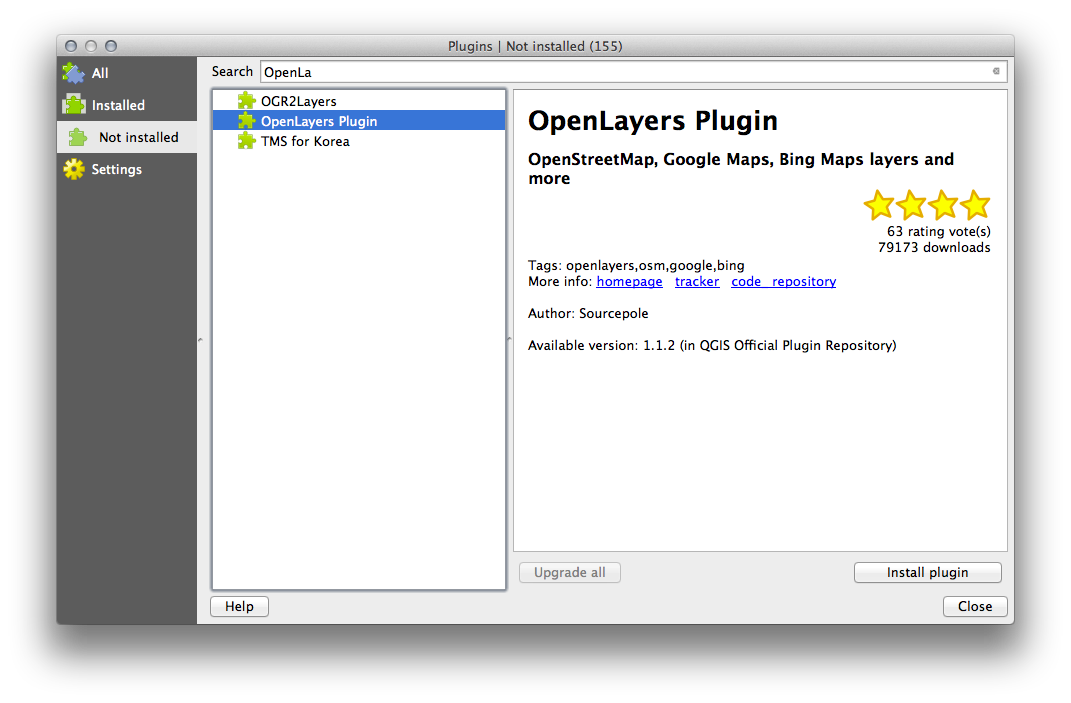
Click the Install plugin button to install.
When it’s done, close the Plugin Manager.
Before using it, make sure that both your map and the plugin are configured properly:
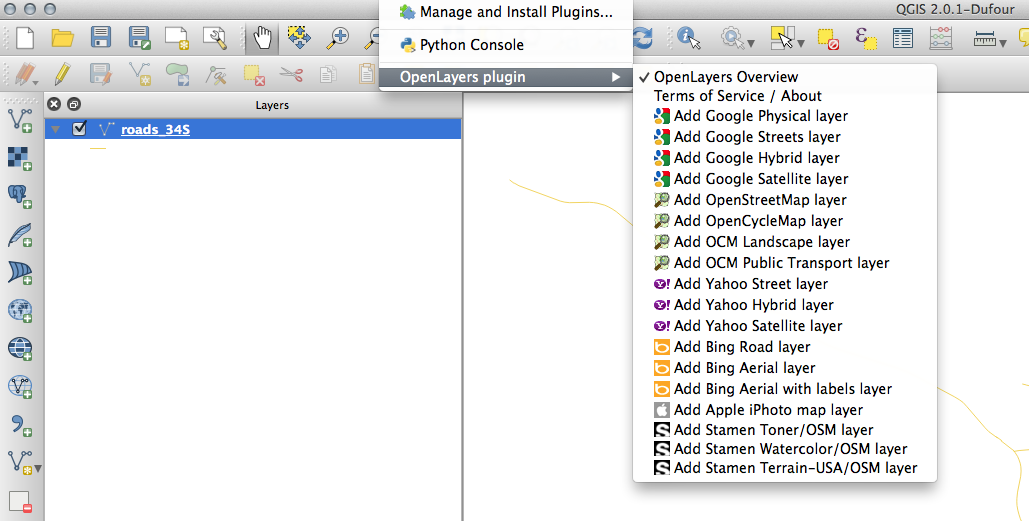
Open the plugin’s settings by clicking on Web ‣ OpenLayers plugin ‣ OpenLayers Overview.
Use the panel to choose a map type you want. In this example, we’ll use the “Hybrid” type map, but you can choose any others if you want.
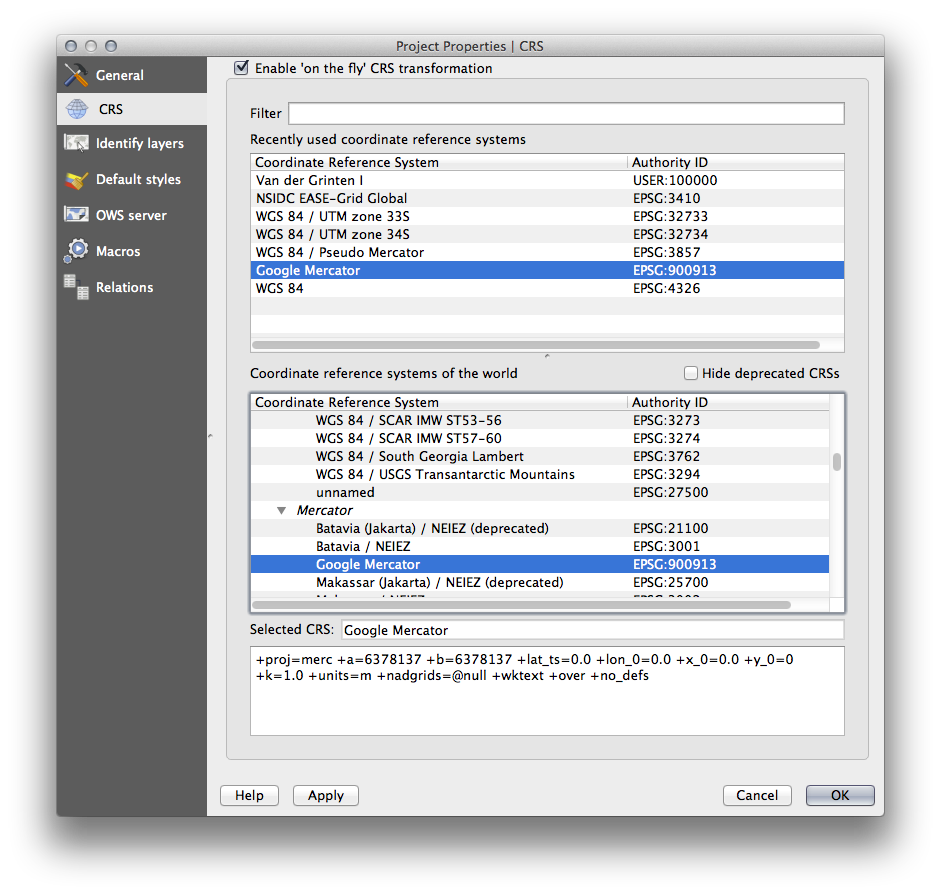
Open the Project Properties Dialog by selecting Project –> Project Properties from the menu.
Enable “on the fly” projection and use the Google Mercator projection:
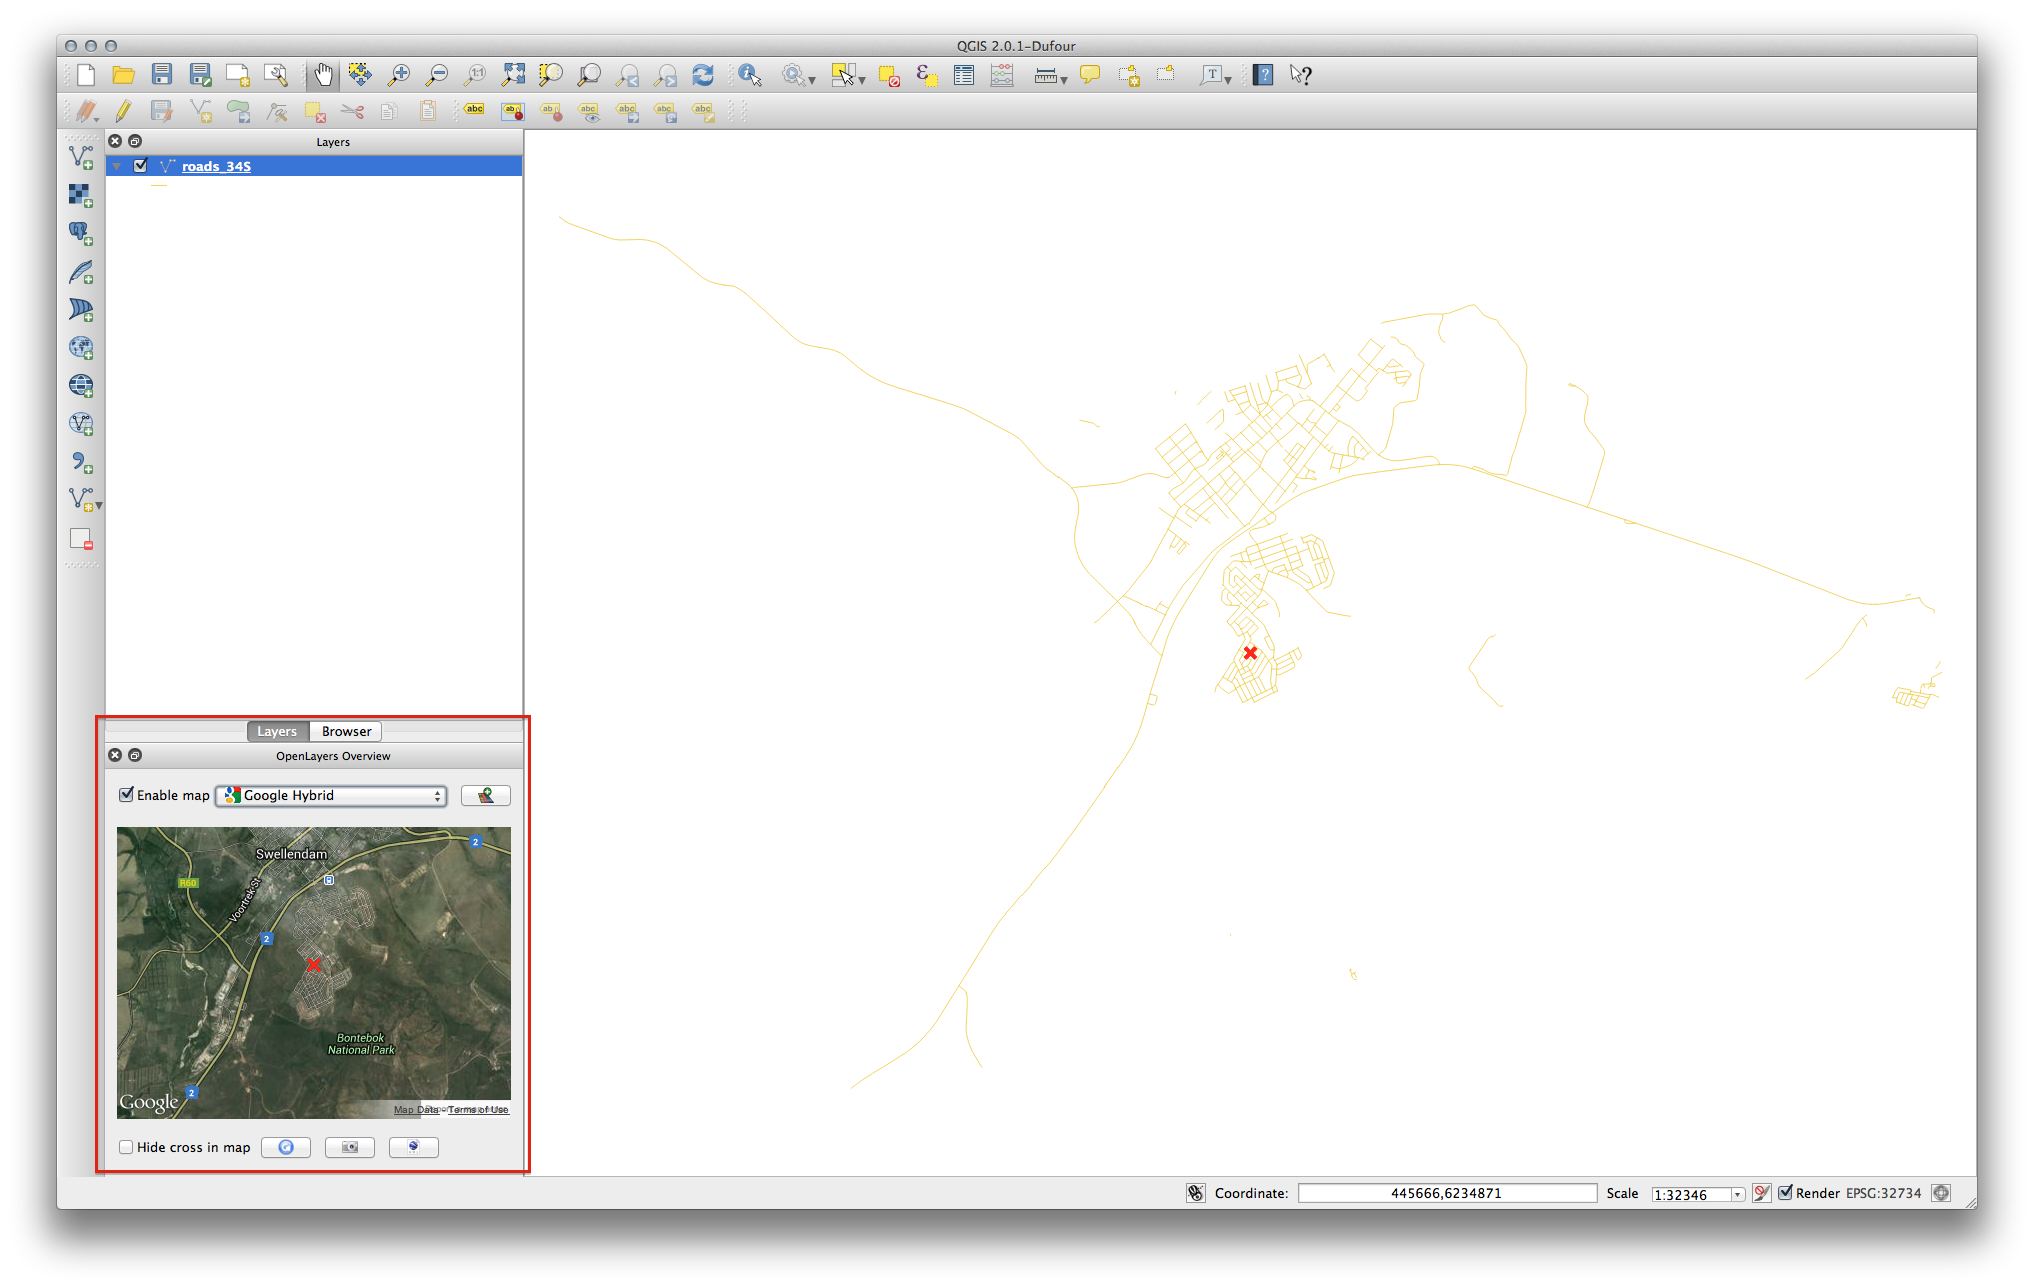
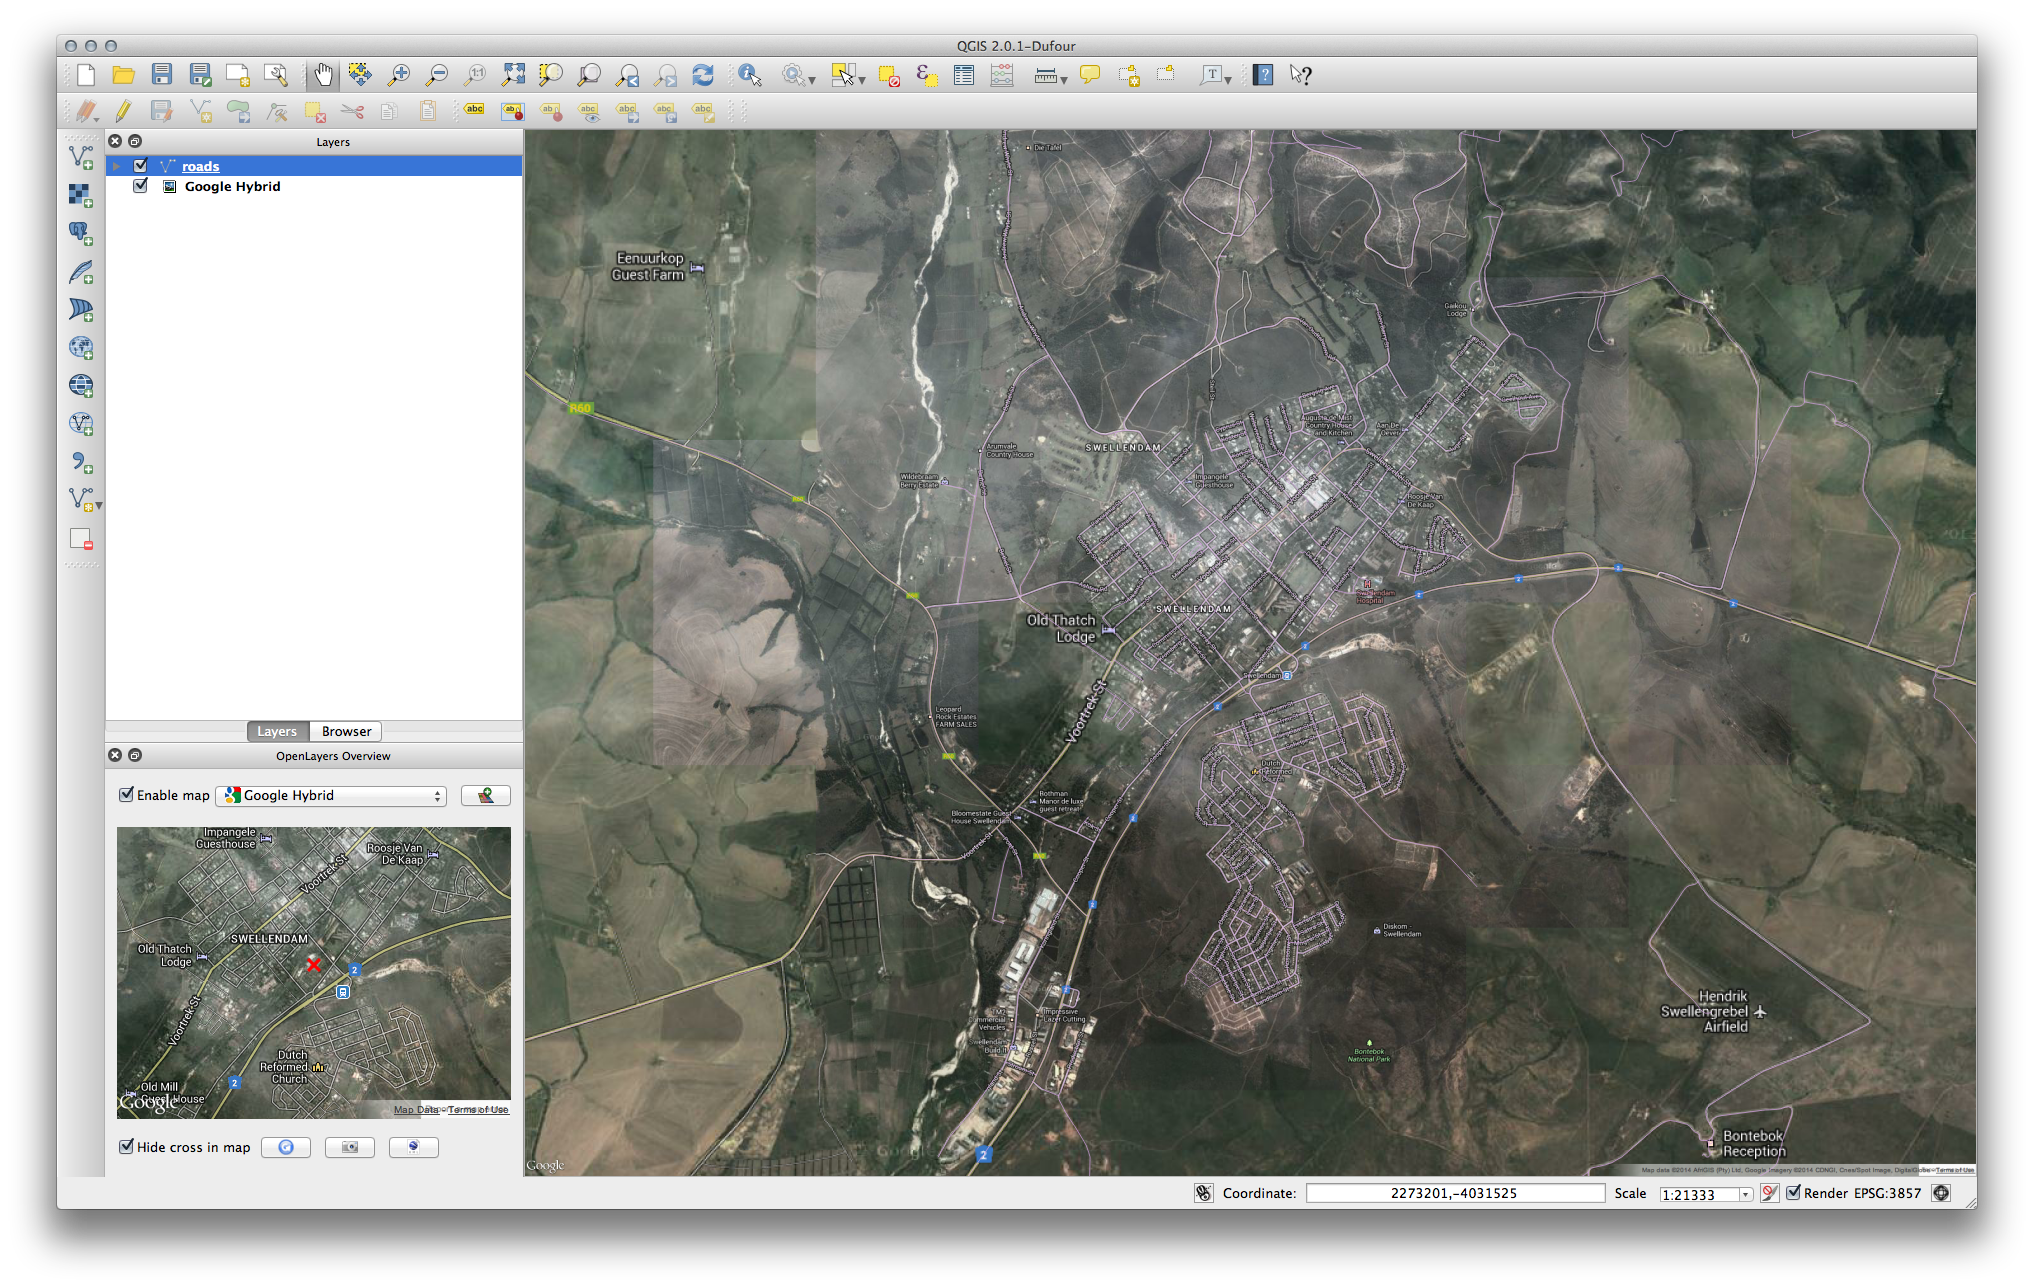
Now use the plugin to give you a Google map of the area. You can click on Plugins ‣ OpenLayers Plugin ‣ Add Google Hybrid Layer to add it:
This will load a new raster image in from Google that you can use as a backdrop, or to help you find out where you are on the map. Here is such a layer, with our own vector road layer as overlay:
ノート
You may need to drag your roads layer above the Google layer to make it visible above the background layer. It may also be necessary to zoom to the extent of the roads layer to re-center the map.
10.2.3.  Follow Along: GeoSearch プラグイン
Start a new map with no datasets.
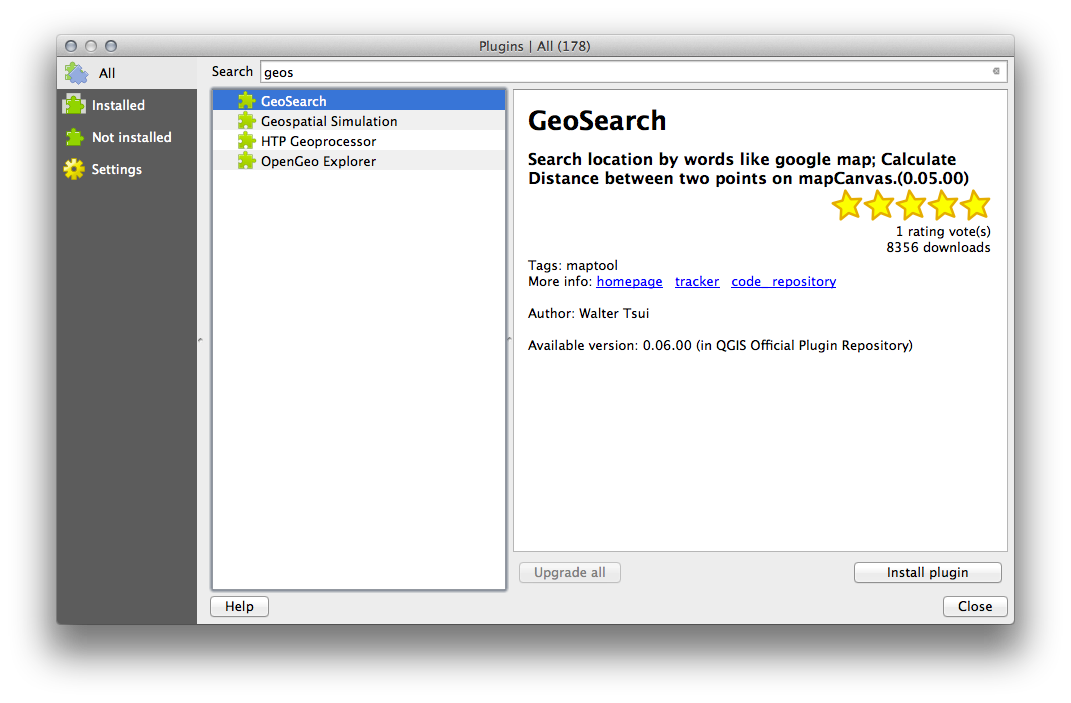
Open the Plugin Manager and filter for the GeoSearch Plugin and click Install Plugin to install it.
Close the Plugin Manager.
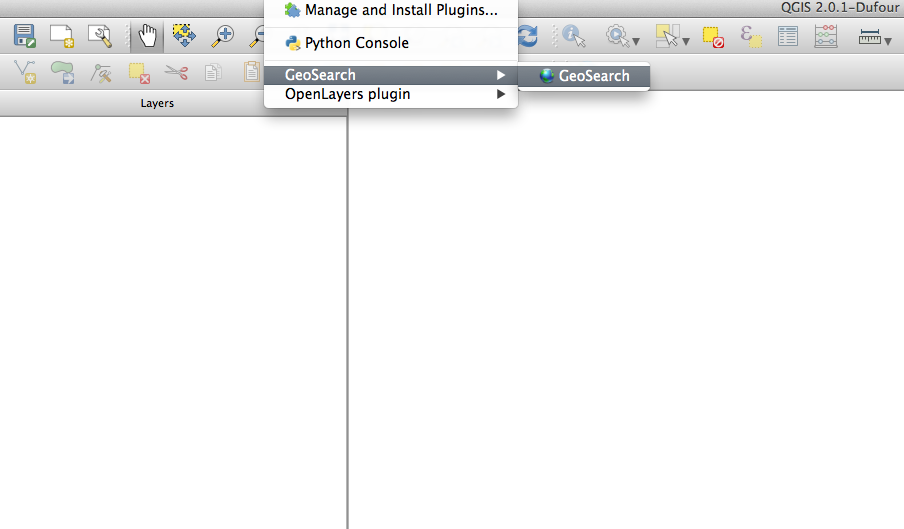
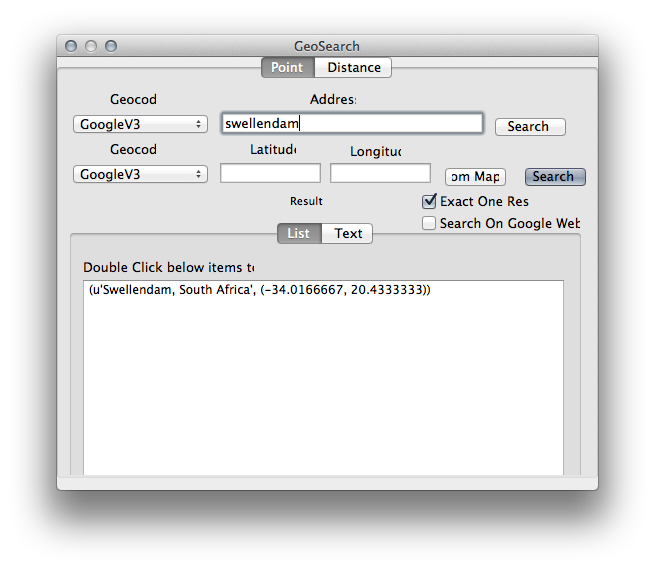
You can now use the GeoSearch plugin to search for placenames. Click on Plugins –> GeoSearch Plugin –> GeoSearch to open the GeoSearch dialog.
Search for Swellendam in the GeoSearch Dialog to locate it on your map:
10.2.4. In Conclusion
QGISではたくさんの便利なプラグインを利用することができます。ビルトインツールを用いてこれらのプラグインを管理すれば、新しいプラグインを見つけ、それらを最適に利用することができます。
10.2.5. What’s Next?
次はリモートサーバにホストされているレイヤをリアルタイムで使う方法を見ていきます。