3.1. Lesson: ベクタデータの操作
おそらくベクトルデータは, あなたが毎日GISを使うデータの中で最も一般的な種類でしょう. ここでは地理データに関してのラインとポリゴンについて説明しています. ベクトルデータセット内のすべてのオブジェクトは**feature**と呼ばれ, その特徴を記述したデータに関連付けられています.
このレッスンの目標: ベクトルデータの構造と, どのようにマップへベクトルデータをロードするかを学びます.
3.1.1.  Follow Along: レイヤー属性の表示
これは, オブジェクトが**どの場所**にあるのか, 使用されているデータだけで表現されていない事を知っておくのが重要です. またこれらのオブジェクトが**どのようなもの**であるかがわかります.
前のレッスンで使用した roads レイヤーがマップにロードされている必要があります. 今あなたが見ることができるのは単なる道路の位置だけです.
選択された roads を見えるように表示するには, レイヤーパネル:
 ボタンをクリックします.
roads に関してより多くのデータが記録されたテーブルが表示されます. この追加データは 属性データ と呼ばれています. 行はマップ上で道路をどのように表現するかを表しています.
これらの定義は一般的にGISで使用されているので, 定義を覚えておくことは不可欠です!
ここで属性テーブルを閉じてください.
ベクトルデータは, 座標平面上で点, 線, 多角形の面での地物を表しています. これは通常, 道路や街区のような個別の地物を格納するために使用されています.
3.1.2. Follow Along: シェープファイルによるベクトルデータのロード
シェープファイルは, 関連するグループのファイルにGISデータを保存することができる特定のファイル形式です. 各レイヤは, 同じ名前で拡張子の異なる複数のファイルで構成されます. シェープファイルはほとんどのGISソフトウェアで読むことができるので, あちこちに送ることが容易です.
ベクトルレイヤを追加する方法については, 前のセクションでの練習を参照してください.
同じ方法に従ってマップへデータセットをロードします.
- “places”
- “water”
- “rivers”
- “buildings”
3.1.3. Follow Along: データベースによるベクトルデータのロード
Databases allow you to store a large volume of associated data in one file. You may already be familiar with a database management system (DBMS) such as Microsoft Access. GIS applications can also make use of databases. GIS-specific DBMSes (such as PostGIS) have extra functions, because they need to handle spatial data.
 のアイコンをクリックします。
(もしそれが全く表示されない場合は、 レイヤ管理 ツールバーのチェックが有効になっているか確認します。)
新しいダイアログが表示されます。このダイアログで:
- Click the New button.
- In the same folder as the other data, you should find the file landuse.sqlite. Select it and click Open.
You will now see the first dialog again. Notice that the dropdown select above the three buttons now reads “land_use.db@...”, followed by the path of the database file on your computer.
接続 ボタンをクリックします。空のボックスでこのように見えるはずです:
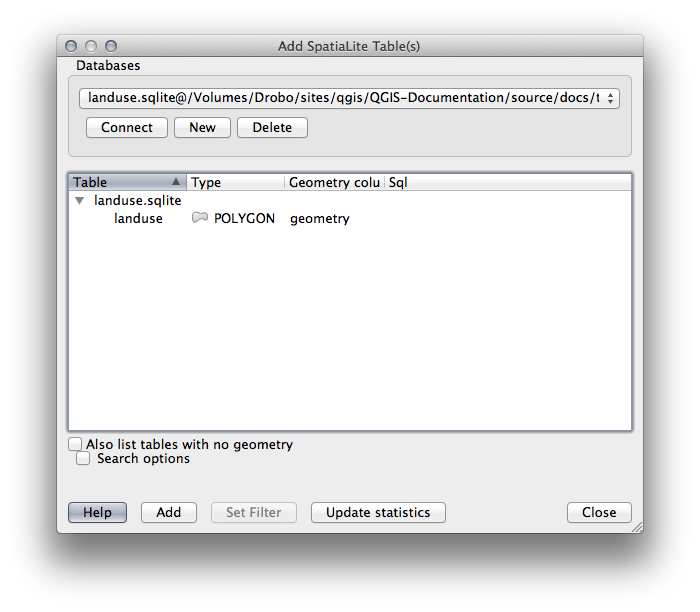
- Click on the landuse layer to select it, then click Add
ノート
Remember to save the map often! The map file doesn’t contain any of the data directly, but it remembers which layers you loaded into your map.
3.1.4. Follow Along: レイヤの順序入れ替え
The layers in your Layers list are drawn on the map in a certain order. The layer at the bottom of the list is drawn first, and the layer at the top is drawn last. By changing the order that they are shown on the list, you can change the order they are drawn in.
ノート
Depending on the version of QGIS that you are using, you may have a checkbox beneath your Layers list reading Control rendering order. This must be checked (switched on) so that moving the layers up and down in the Layers list will bring them to the front or send them to the back in the map. If your version of QGIS doesn’t have this option, then it is switched on by default and you don’t need to worry about it.
The order in which the layers have been loaded into the map is probably not logical at this stage. It’s possible that the road layer is completely hidden because other layers are on top of it.
たとえば、このレイヤ順は・・・
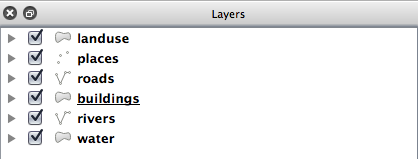
... would result in roads and places being hidden as they run underneath urban areas.
問題を解決するために:
- Click and drag on a layer in the Layers list.
こう見えるようにそれらの順番を入れ替えます:
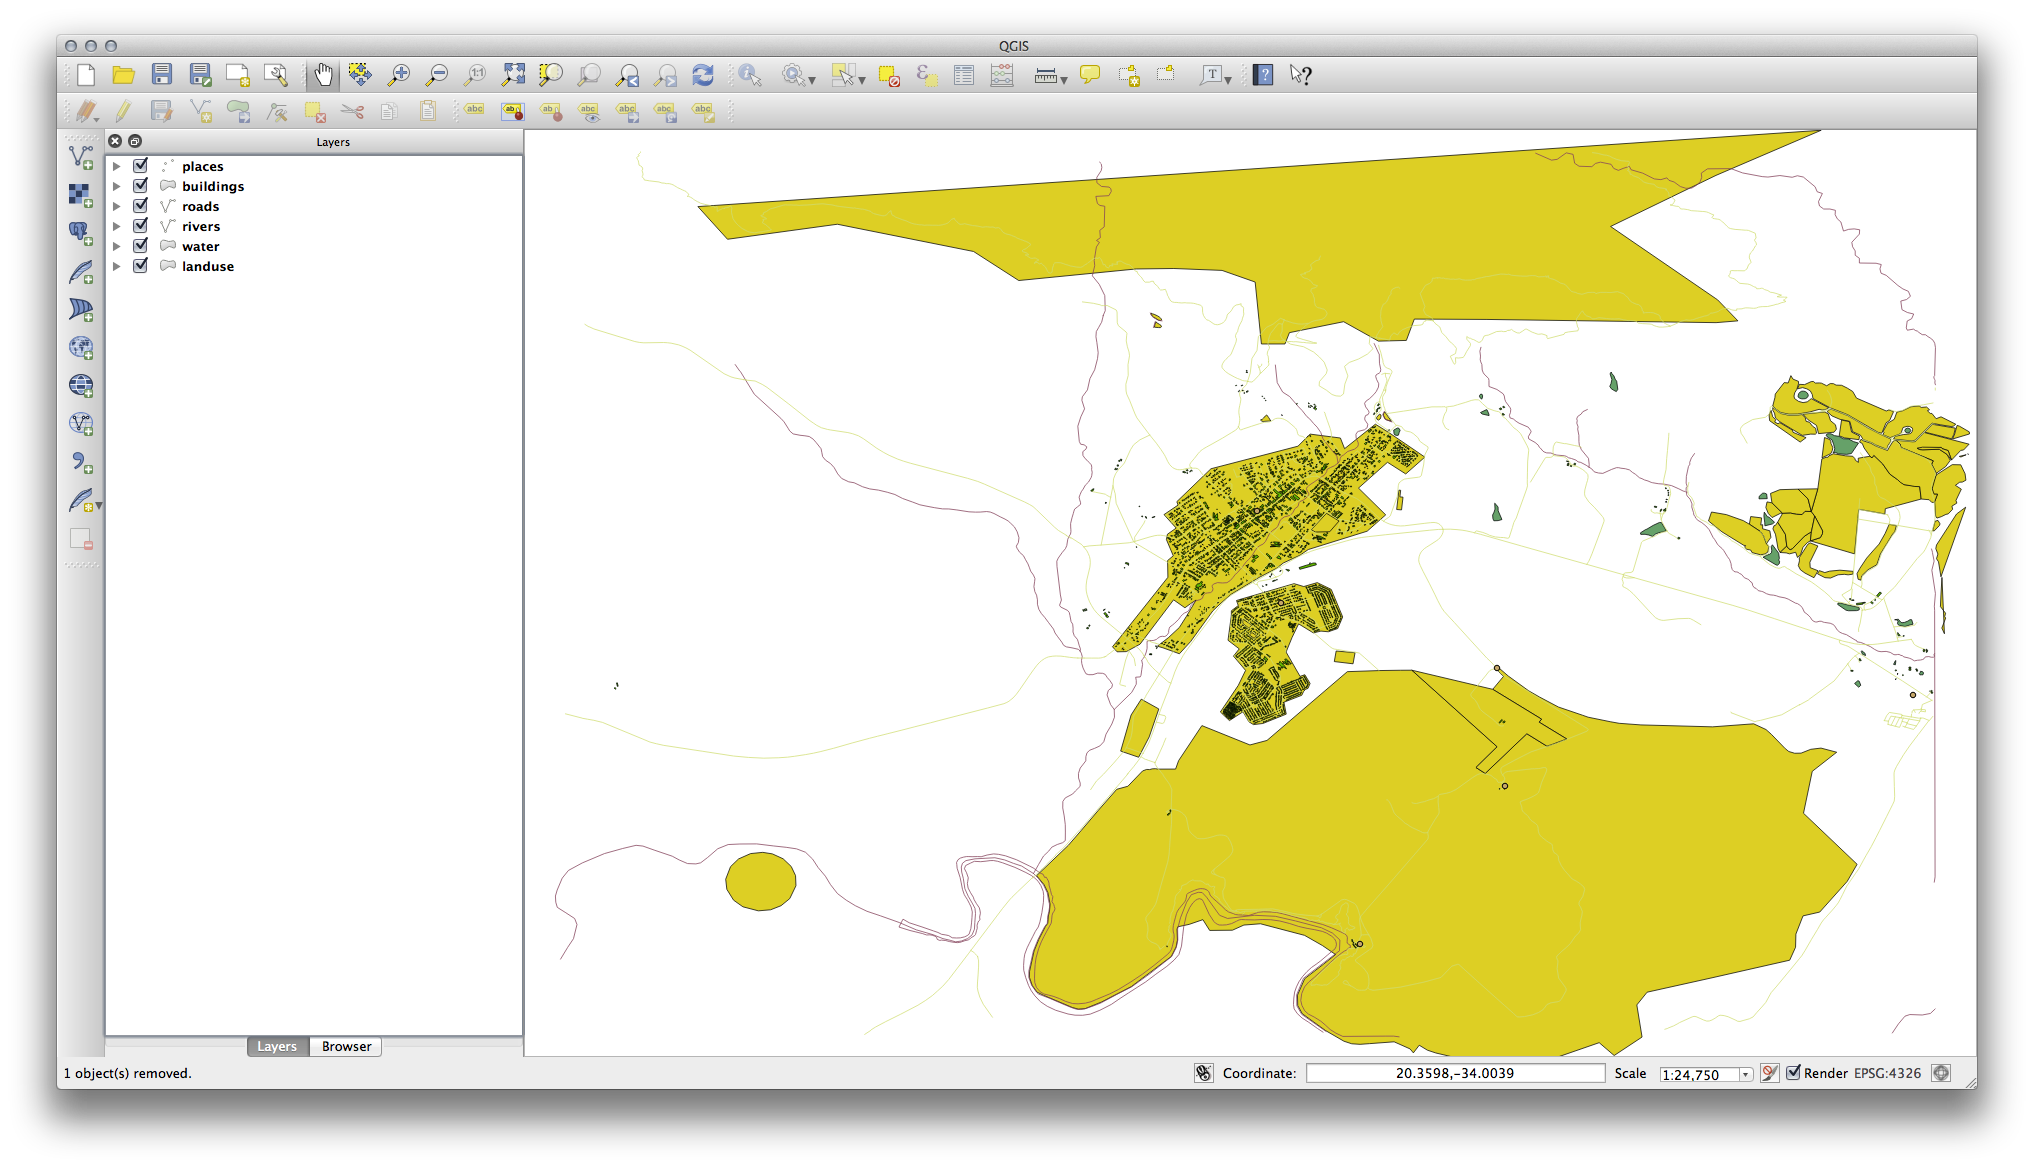
You’ll see that the map now makes more sense visually, with roads and buildings appearing above the land use regions.
3.1.5. In Conclusion
Now you’ve added all the layers you need from several different sources.
3.1.6. What’s Next?
Using the random palette automatically assigned when loading the layers, your current map is probably not easy to read. It would be preferable to assign your own choice of colors and symbols. This is what you’ll learn to do in the next lesson.