7.3. Lesson: ネットワーク分析
2点間の最短距離を計算するために一般的なGISを使用することです。このツールをQGISは搭載していますが、それは、デフォルトでは表示されていません。この短いレッスンでは、始めるために必要な方法を紹介します。
このレッスンの目標: 道路グラフ プラグインの有効化、設定と利用。
7.3.1.  Follow Along: ツールの有効化
QGISは、その基本的な機能に追加する多くのプラグインがあります。これらのプラグインの多くは、入手後すぐにプログラムと一緒に利用できるため便利です。それらはまだしかし、デフォルトでは非表示にしています。そのため、それらを使用するためには、まず有効にする必要があります。
道路グラフ プラグインの有効化:
QGISのメイン画面にあるメニューの プラグイン ‣ プラグインの管理とインストール... をクリックすることで、 プラグインマネージャ を起動します。ダイアログが表示されます。
このようにプラグインを選択します:
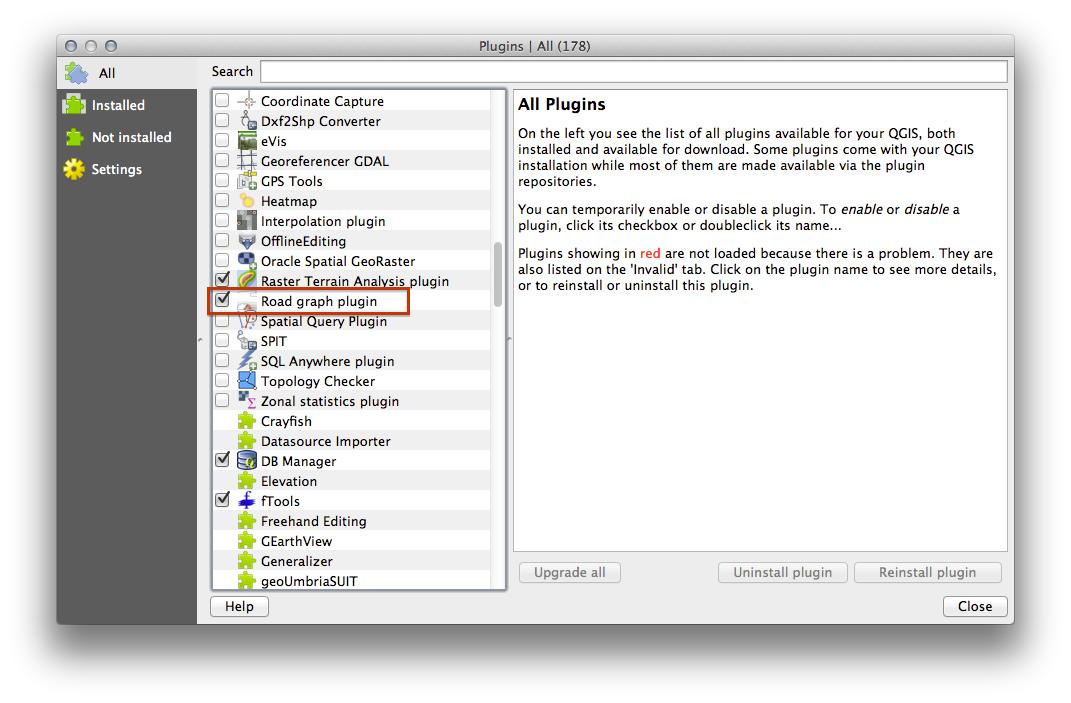
プラグインマネージャ の 閉じる をクリックします。
ノート
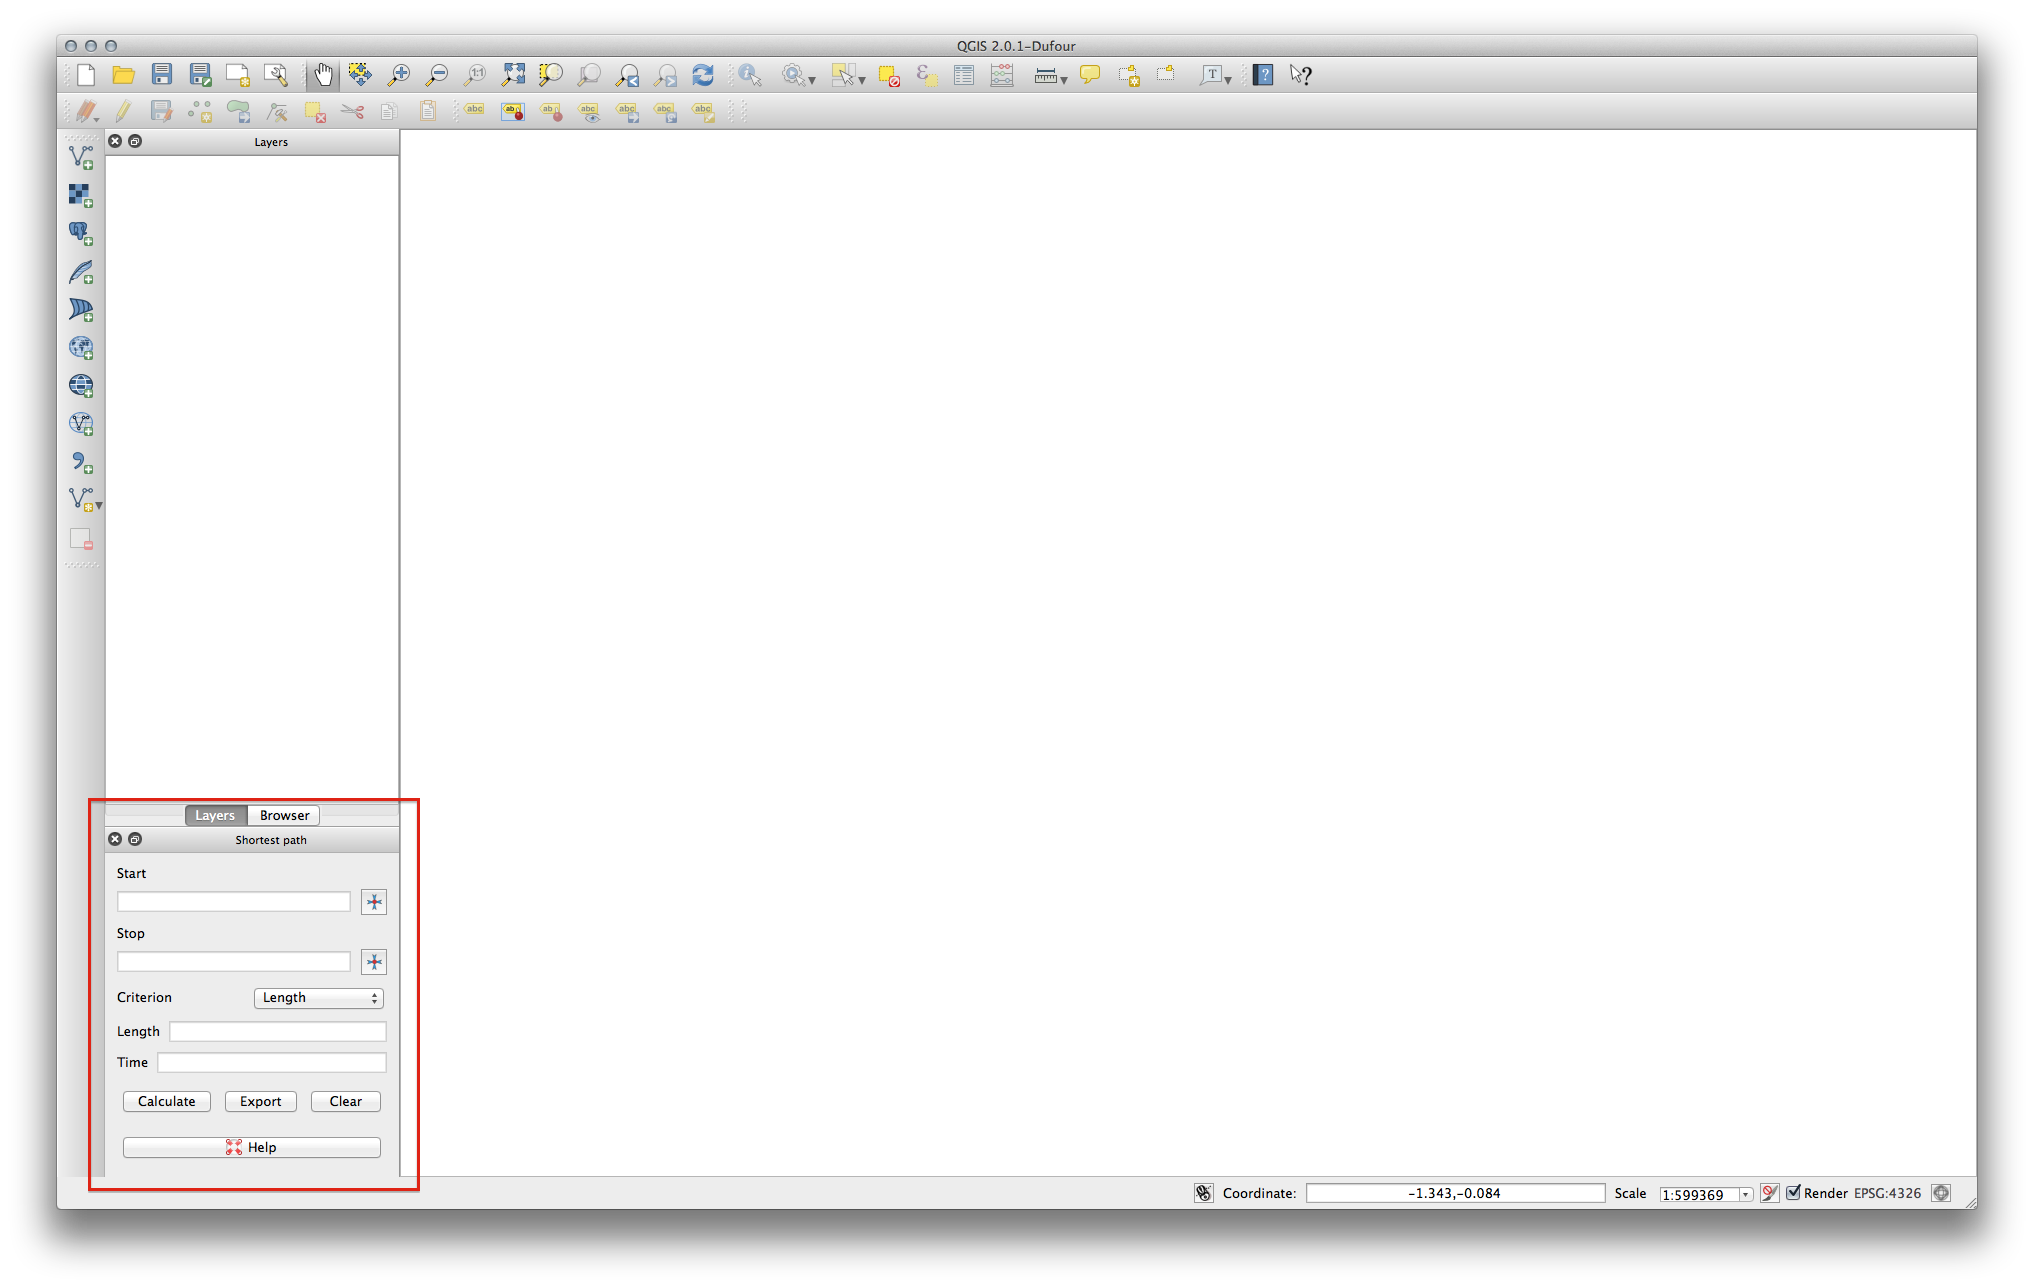
If you do not see the plugin in your interface, go to View ‣ Panels and ensure that Shortest path has a check mark next to it.
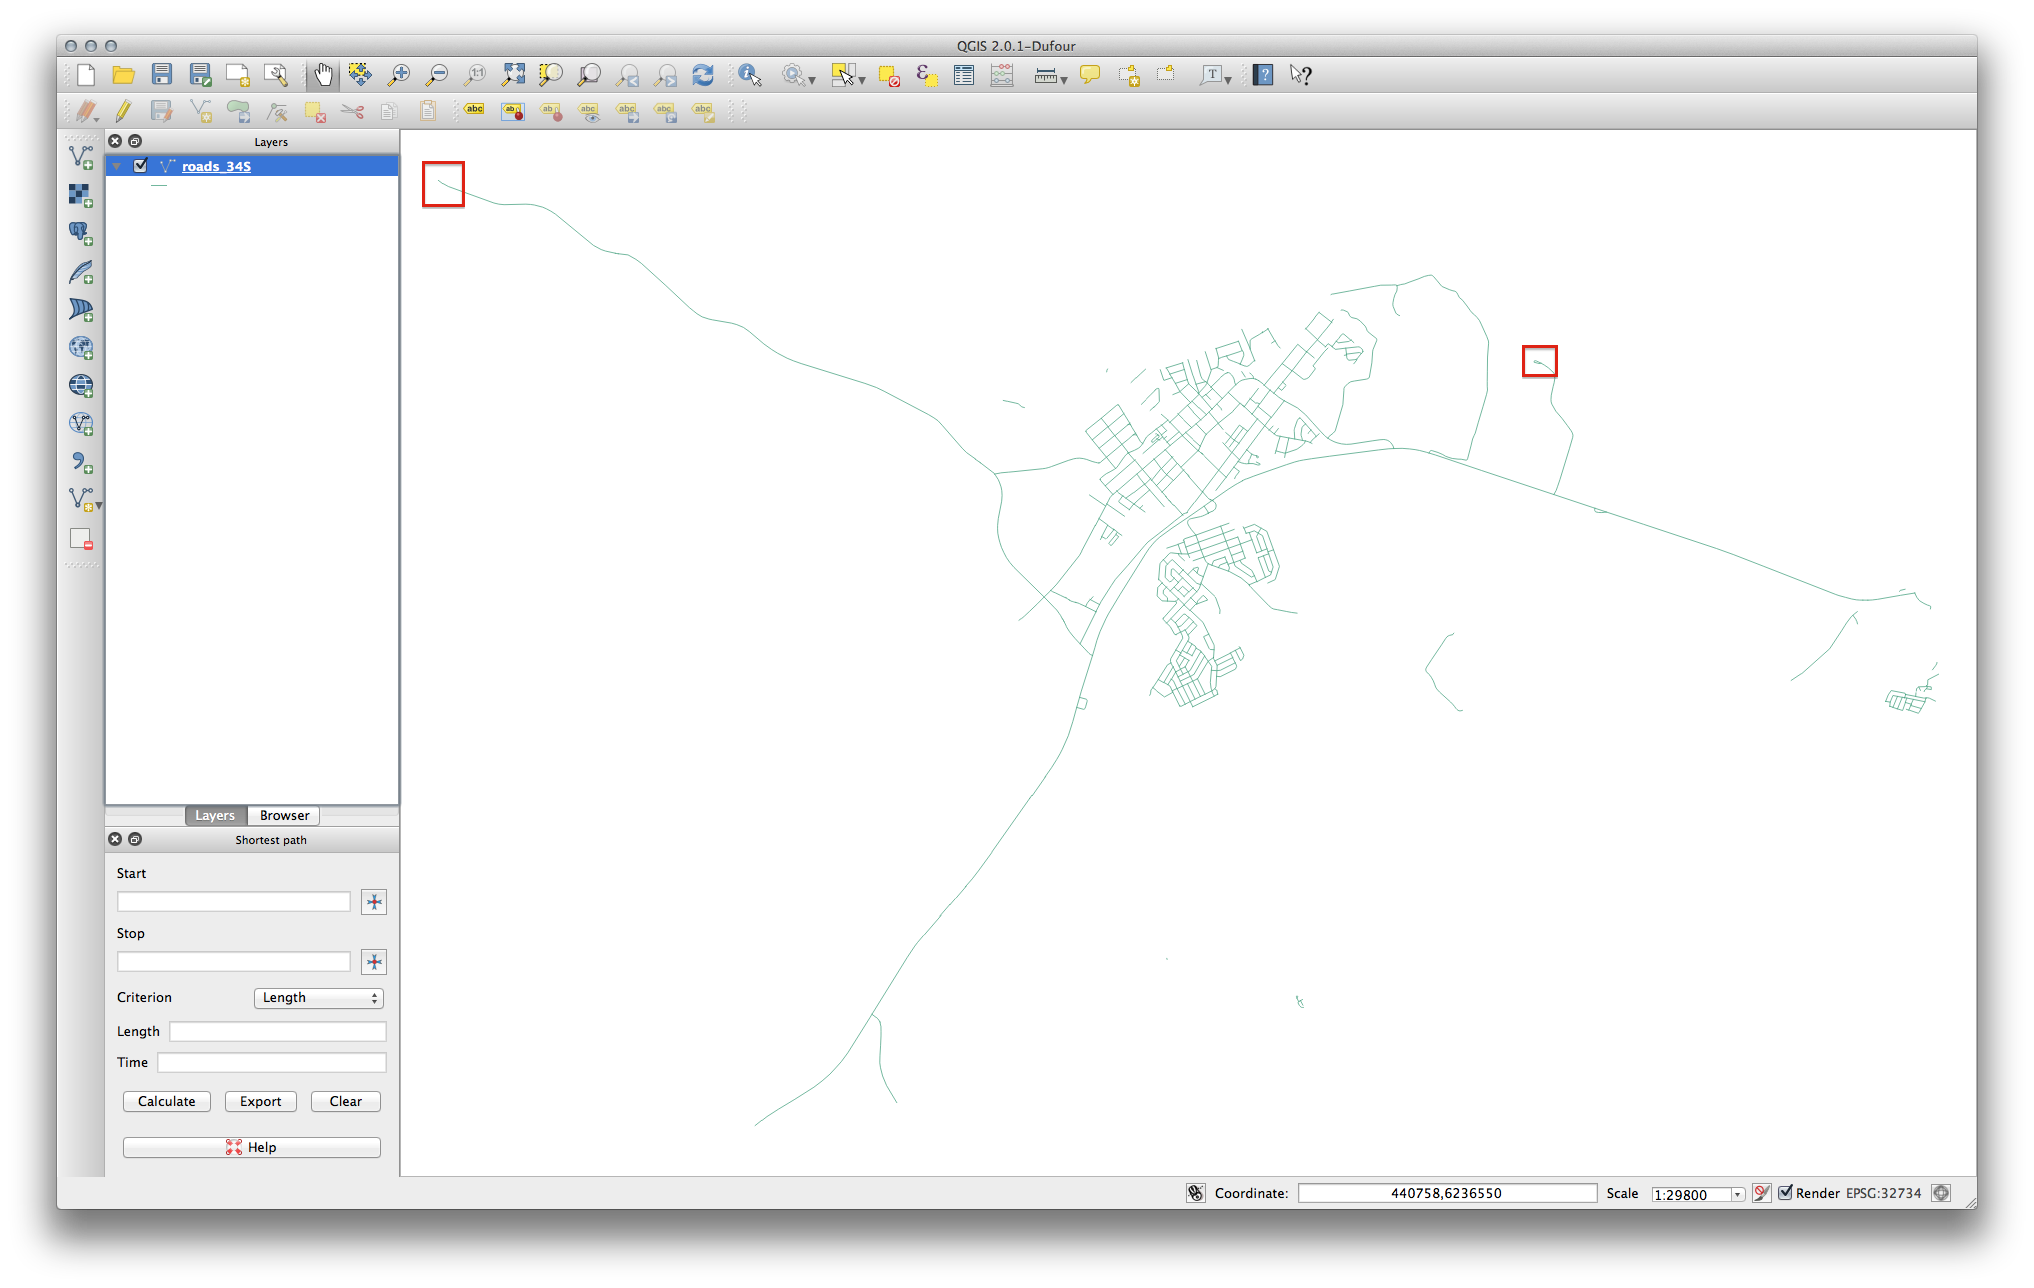
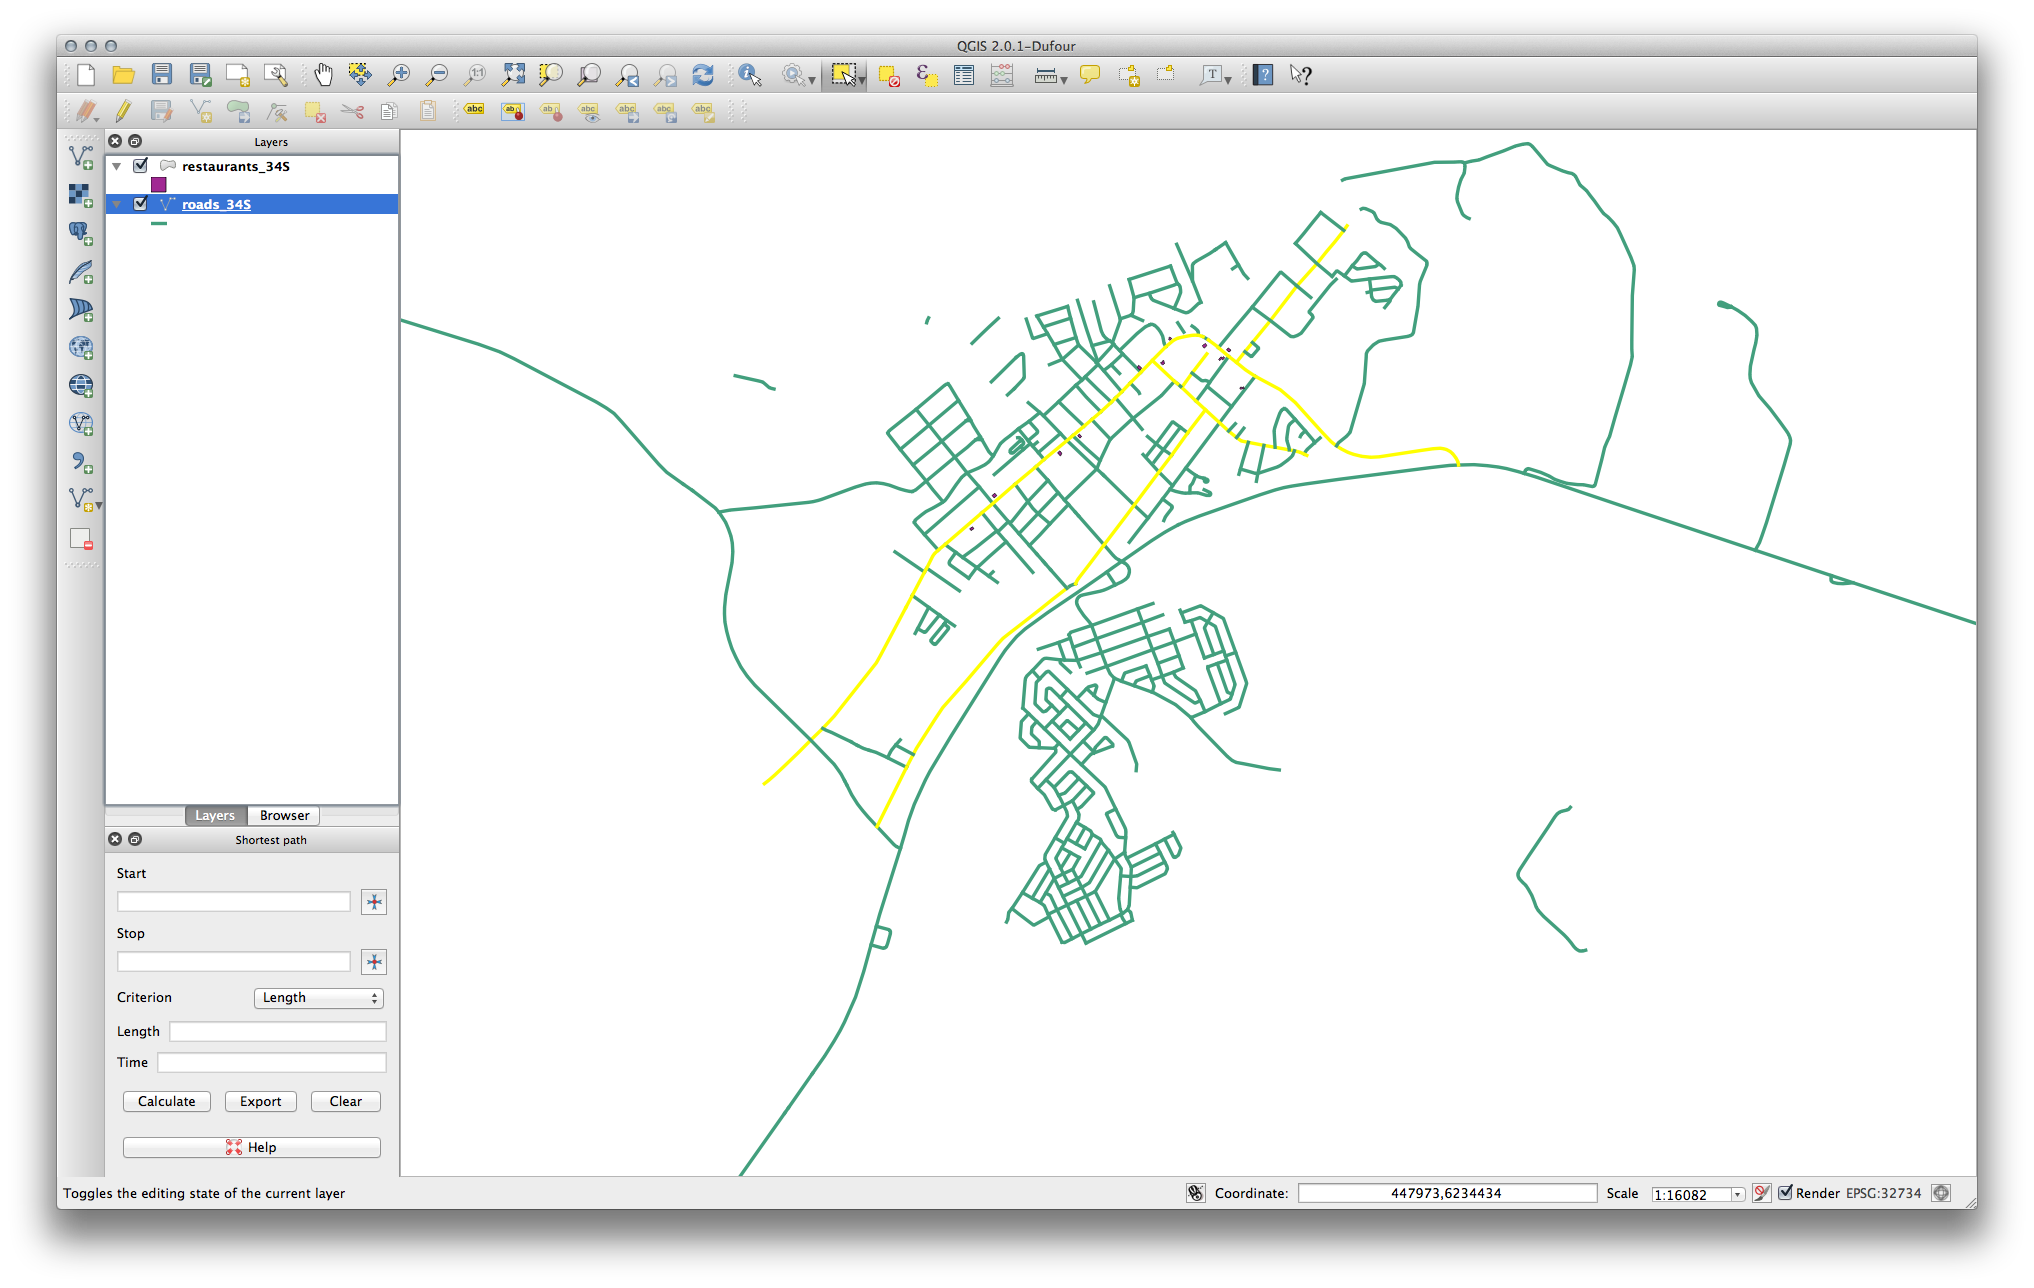
このパネルはインタフェースで表示されるでしょう:
7.3.2. Follow Along: ツールの設定
To have a layer to calculate on, first save your current map. If you haven’t already done so, save your roads_34S layer to a shapefile by right-clicking the layer and selecting Save as.... Create a new map and load this layer into it.
Since so many different configurations are possible when analyzing networks, the plugin doesn’t assume anything before you’ve set it up. This means that it won’t do anything at all if you don’t set it up first.
- Click on the menu item Vector ‣ Road graph ‣ settings. A dialog will appear.
このように設定されていることを確認します(特に指定しない限りデフォルトを使用)。
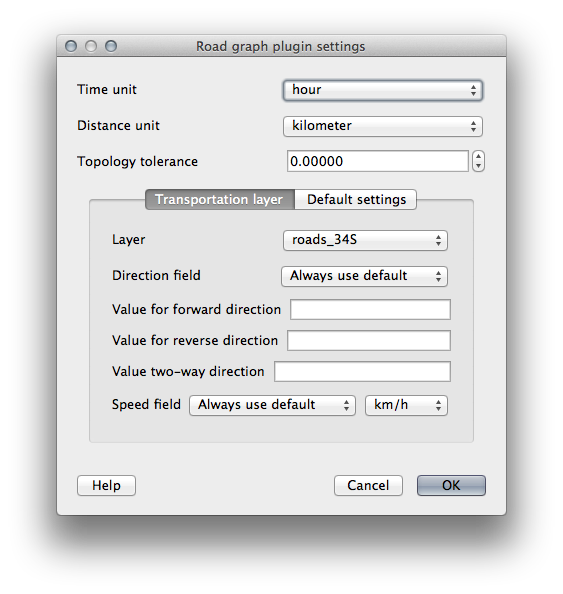
時間の単位: 時間
距離の単位: km
レイヤ: roads_34S
速度フィールド: 常にデフォルトを使用 / km/h
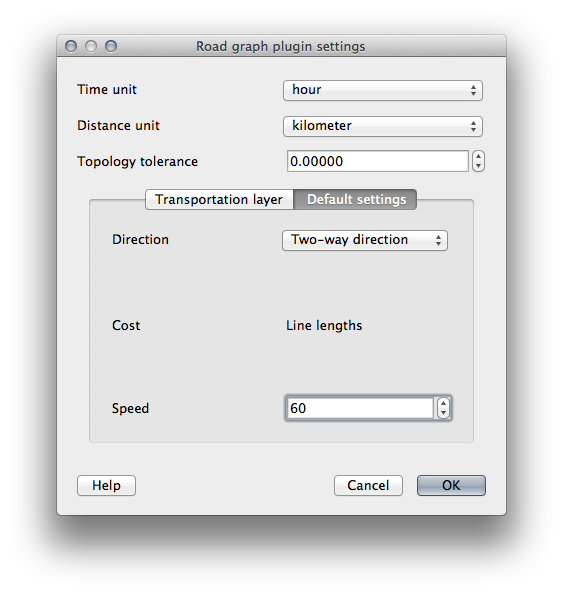
方向: 両方向
スピード: 60
7.3.3. Follow Along: ツールの使用
Find two points, on roads, on your map. They do not need to have any significance, but they should be connected by roads and separated by a reasonable distance:
- In the plugin panel, click on the Capture Point button next to the Start field:
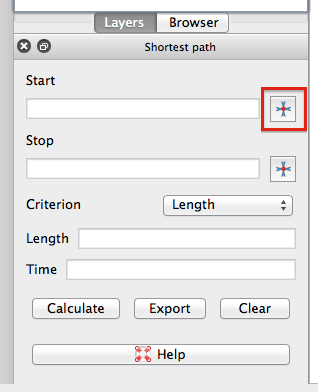
選択した始点でクリックします。
- Use the Capture Point button next to the Stop field and capture your chosen end point.
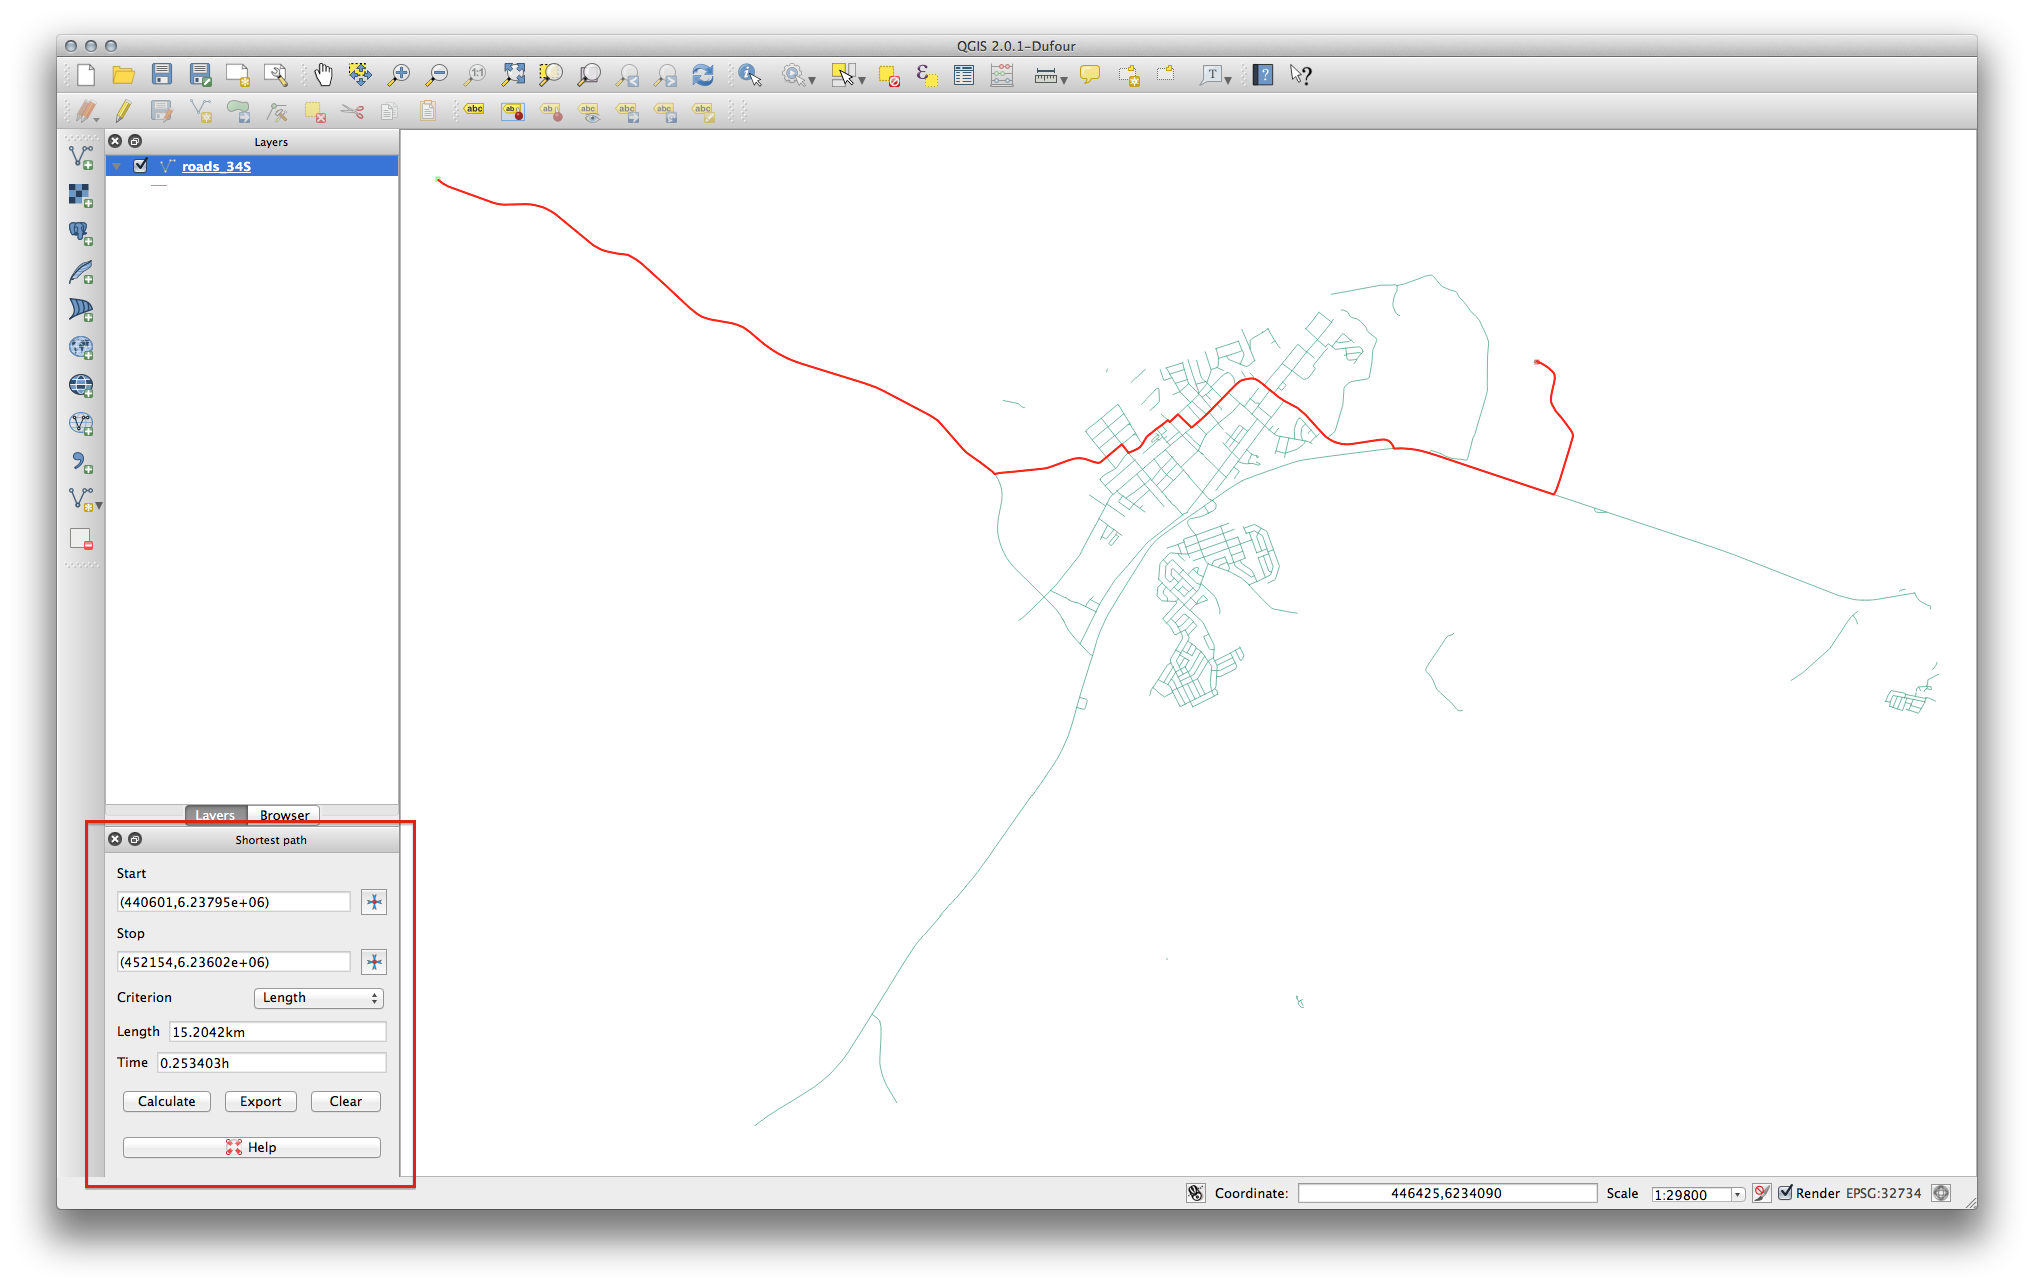
- Click on the Calculate button to see the solution:
7.3.4.  Follow Along: 階級の使用
ノート
Section developed by Linfiniti and S Motala (Cape Peninsula University of Technology)
- Add your restaurants_34S layer to the map (extract it from your analyis map if necessary).
- Open the attribute table for the roads_34S layer and enter edit mode.
- Add a new column with the name SPEED, and give it the type Whole number (integer) with a width of 3.
- In the main window, activate the Select Features by Rectangle tool:
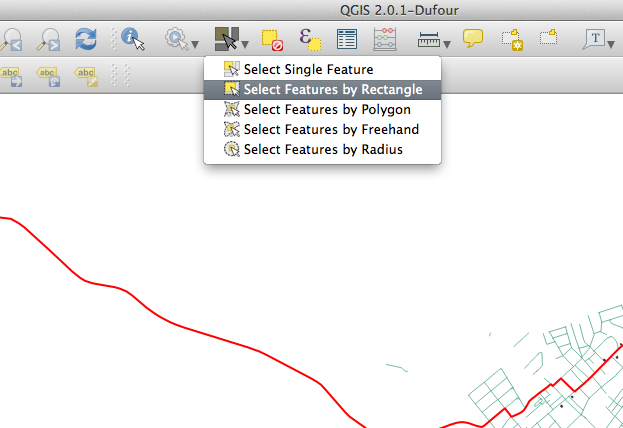
- Select any main roads in urban - but not residential - areas:
(To select more than one road, hold the ctrl button and drag a box across any road that you want to include in the selection.)
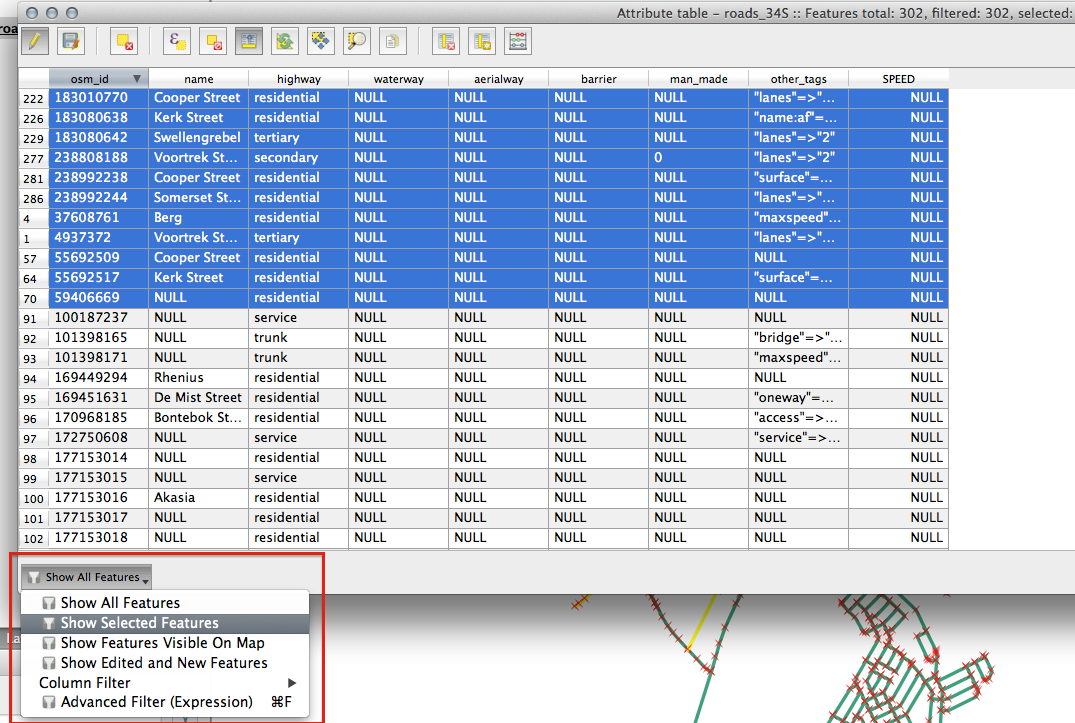
In the attribute table, select Show selected features.
Set the SPEED value for all the selected streets to 60:
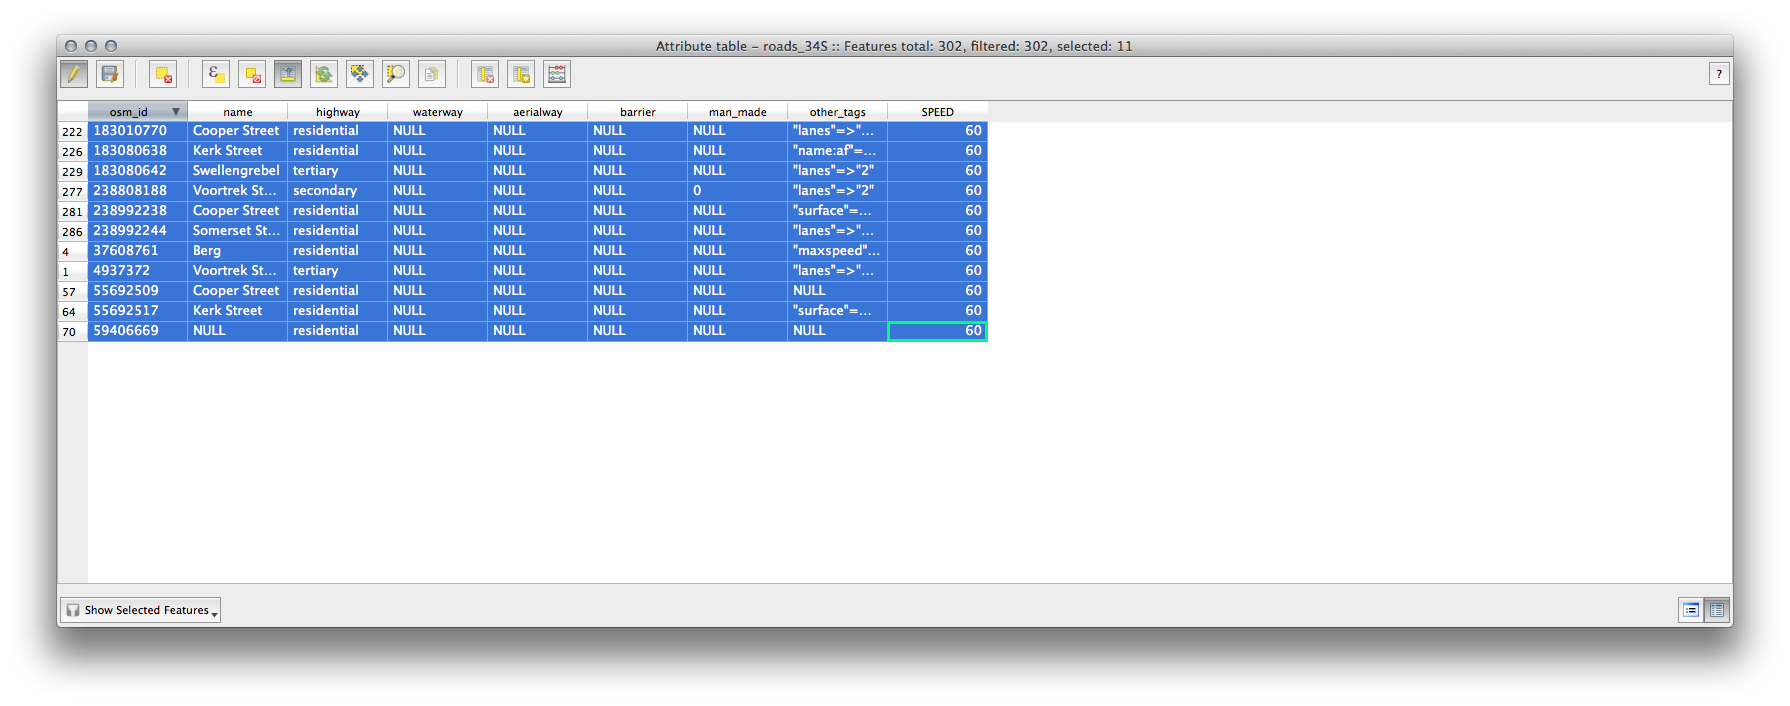
In context, this means that you’re setting the speed limit on those roads to 60 km/h.
- Select any highways or major roads outside urban areas:
- Set the SPEED value for all the selected streets to 120.
- Close the attribute table, save your edits, and exit edit mode.
- Check the Vector ‣ Road graph ‣ Road graph settings to ensure that it’s set up as explained previously in this lesson, but with the Speed value set to the SPEED field you just created.
- In the Shortest path panel, click the Start point button.
- Set the starting point on a minor road on one side of Swellendam and the end point on a major road on the other side of town:
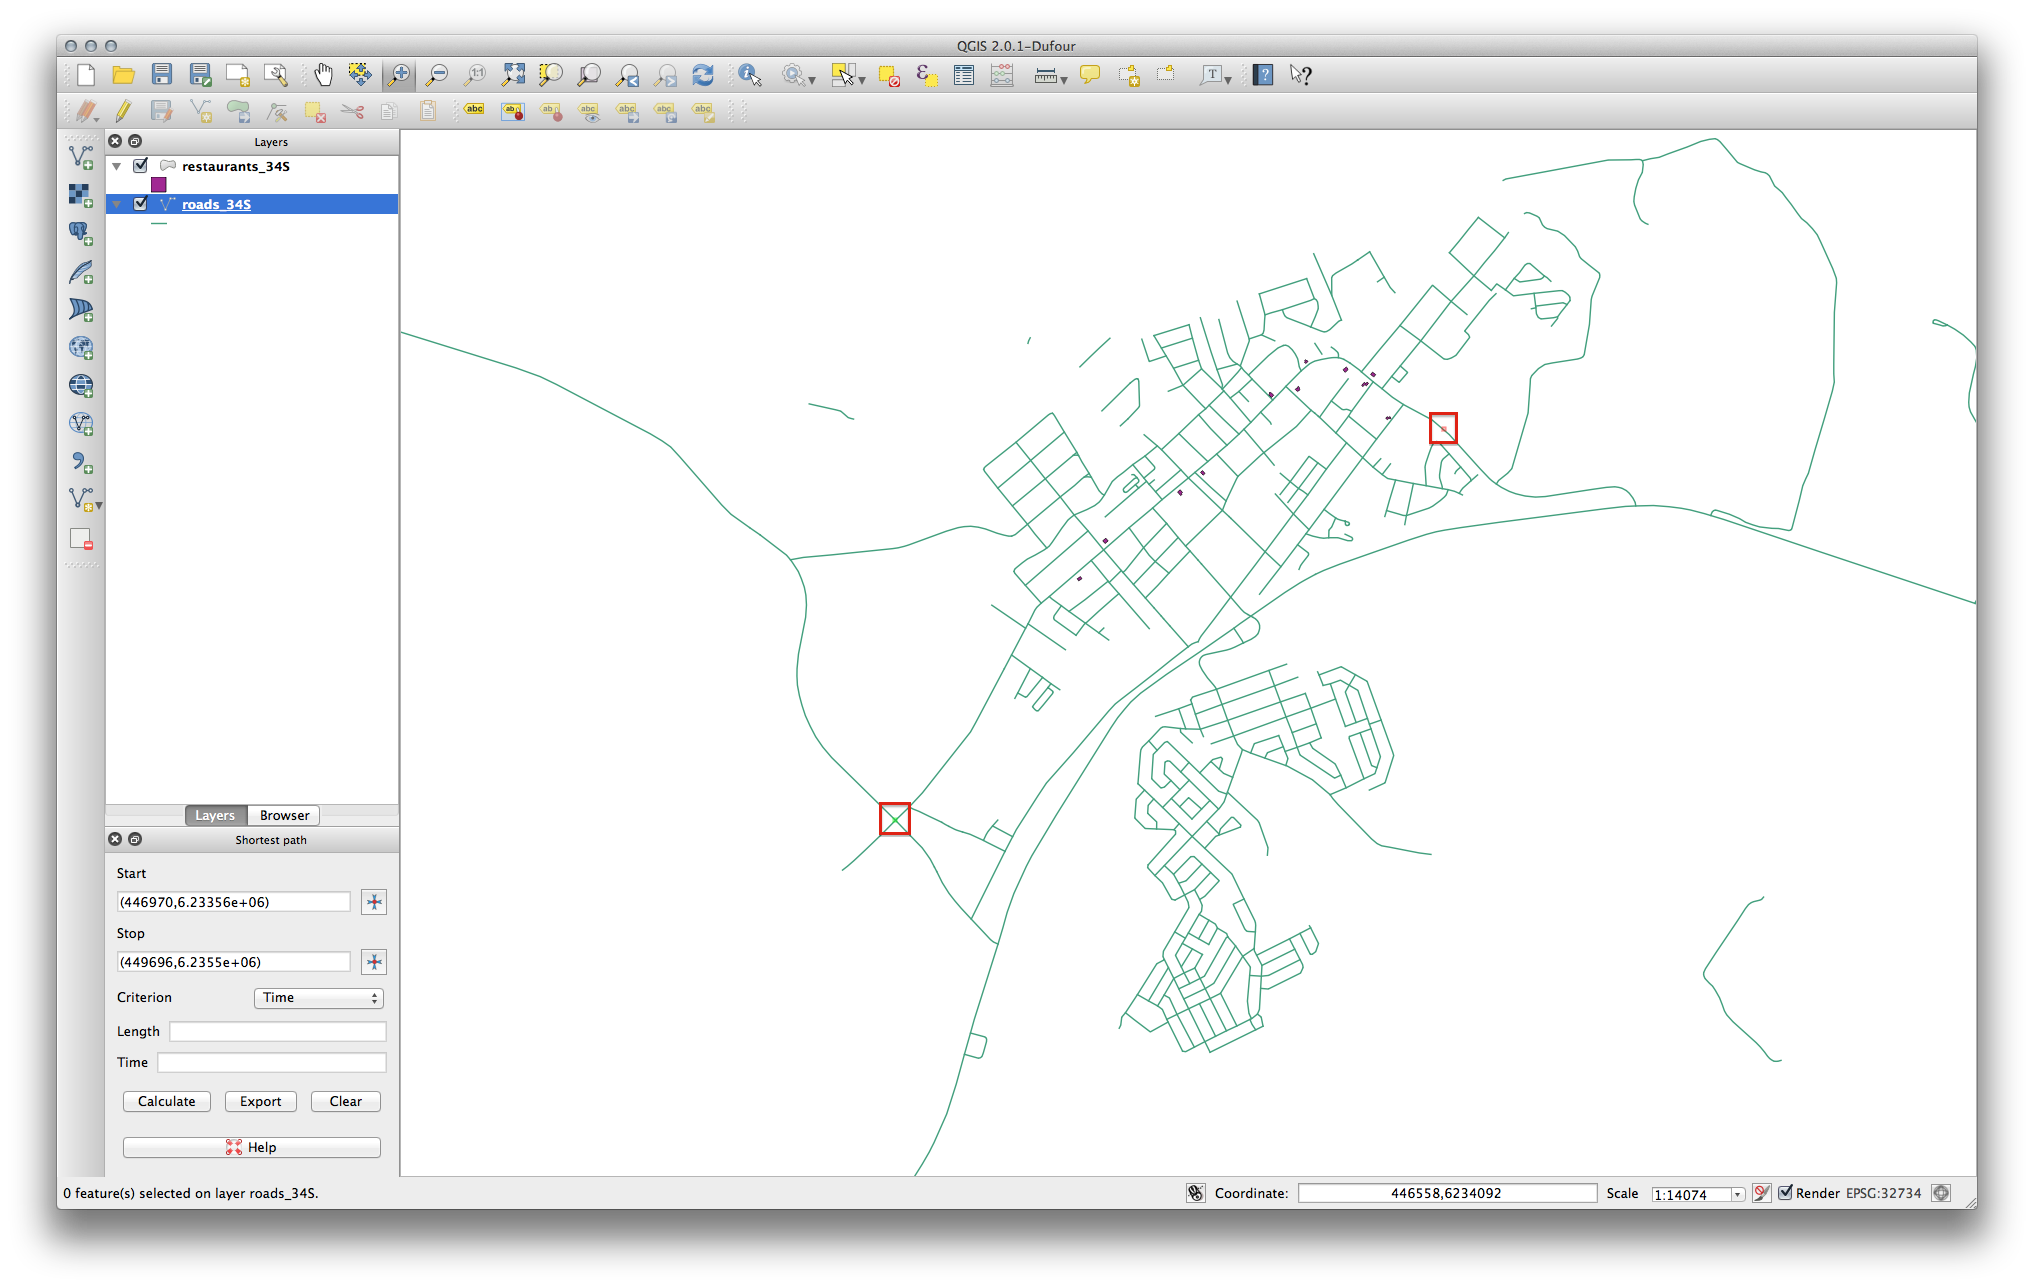
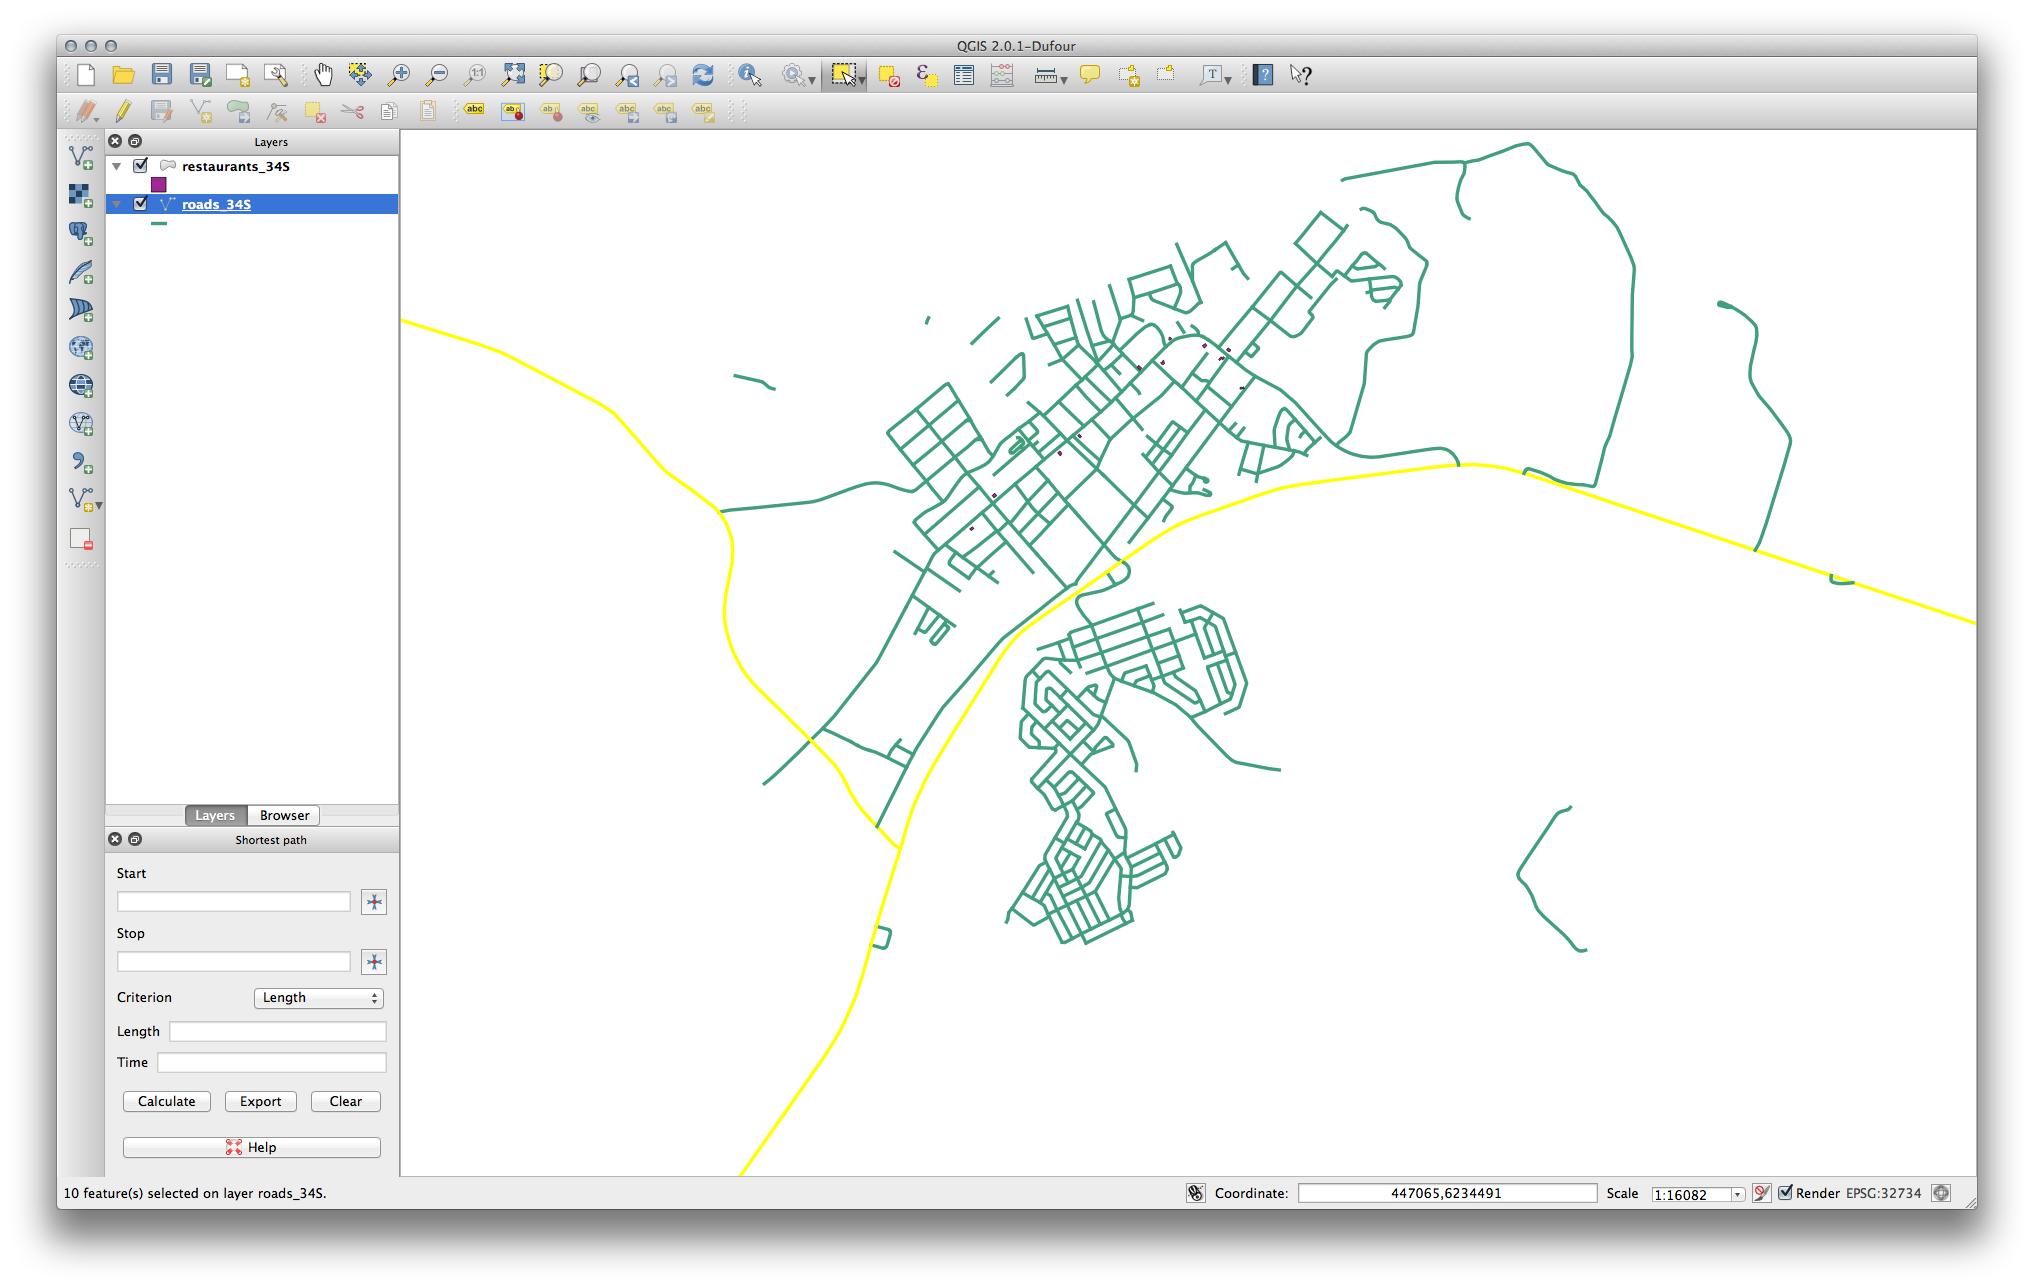
- In the Criterion drop-down list in the Shortest path panel, select Length.
- Click Calculate. The route will be calculated for the shortest distance:
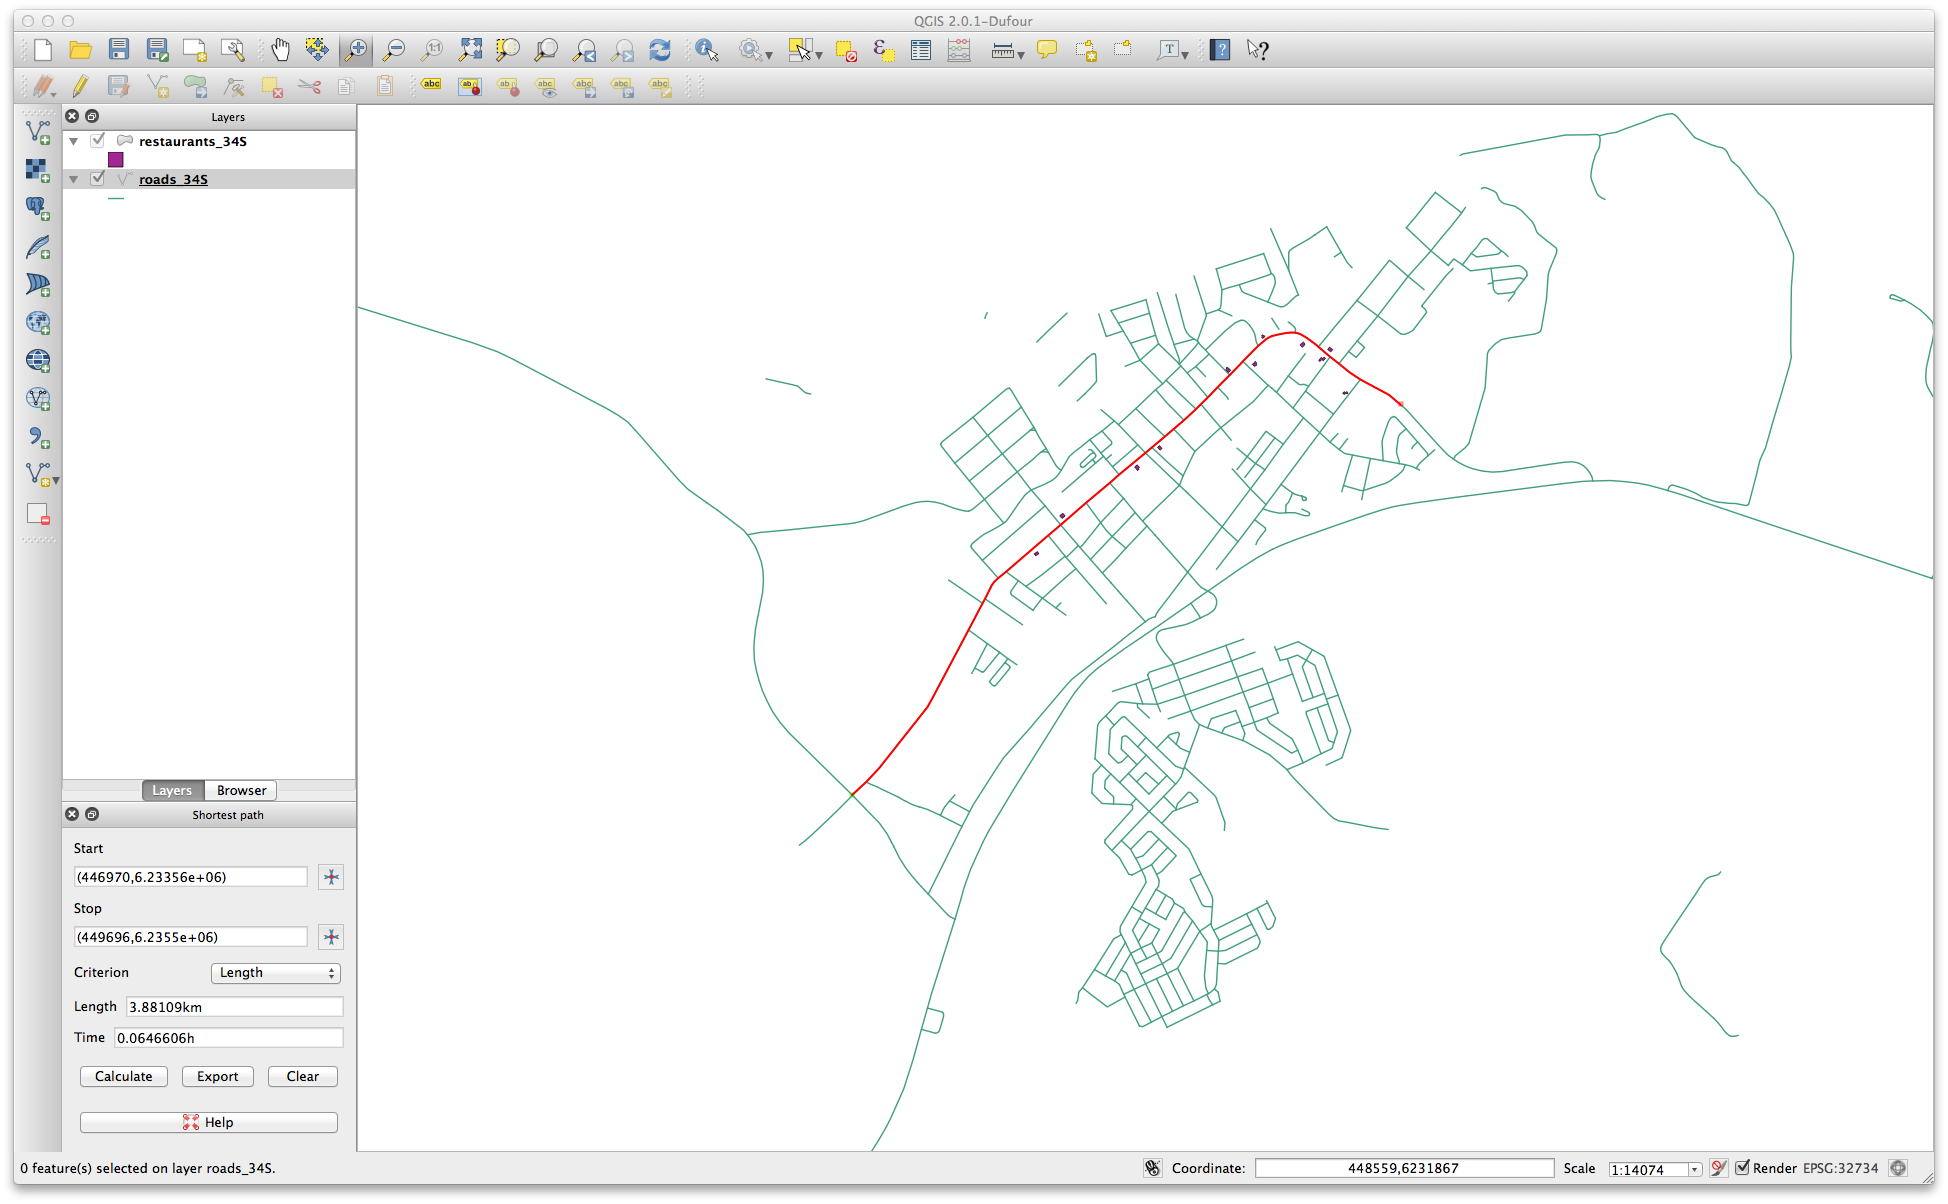
Notice the values of Length and Time in the Shortest path panel.
- Set the Criterion to Time.
- Click Calculate again. The route will be calculated for the shortest time:
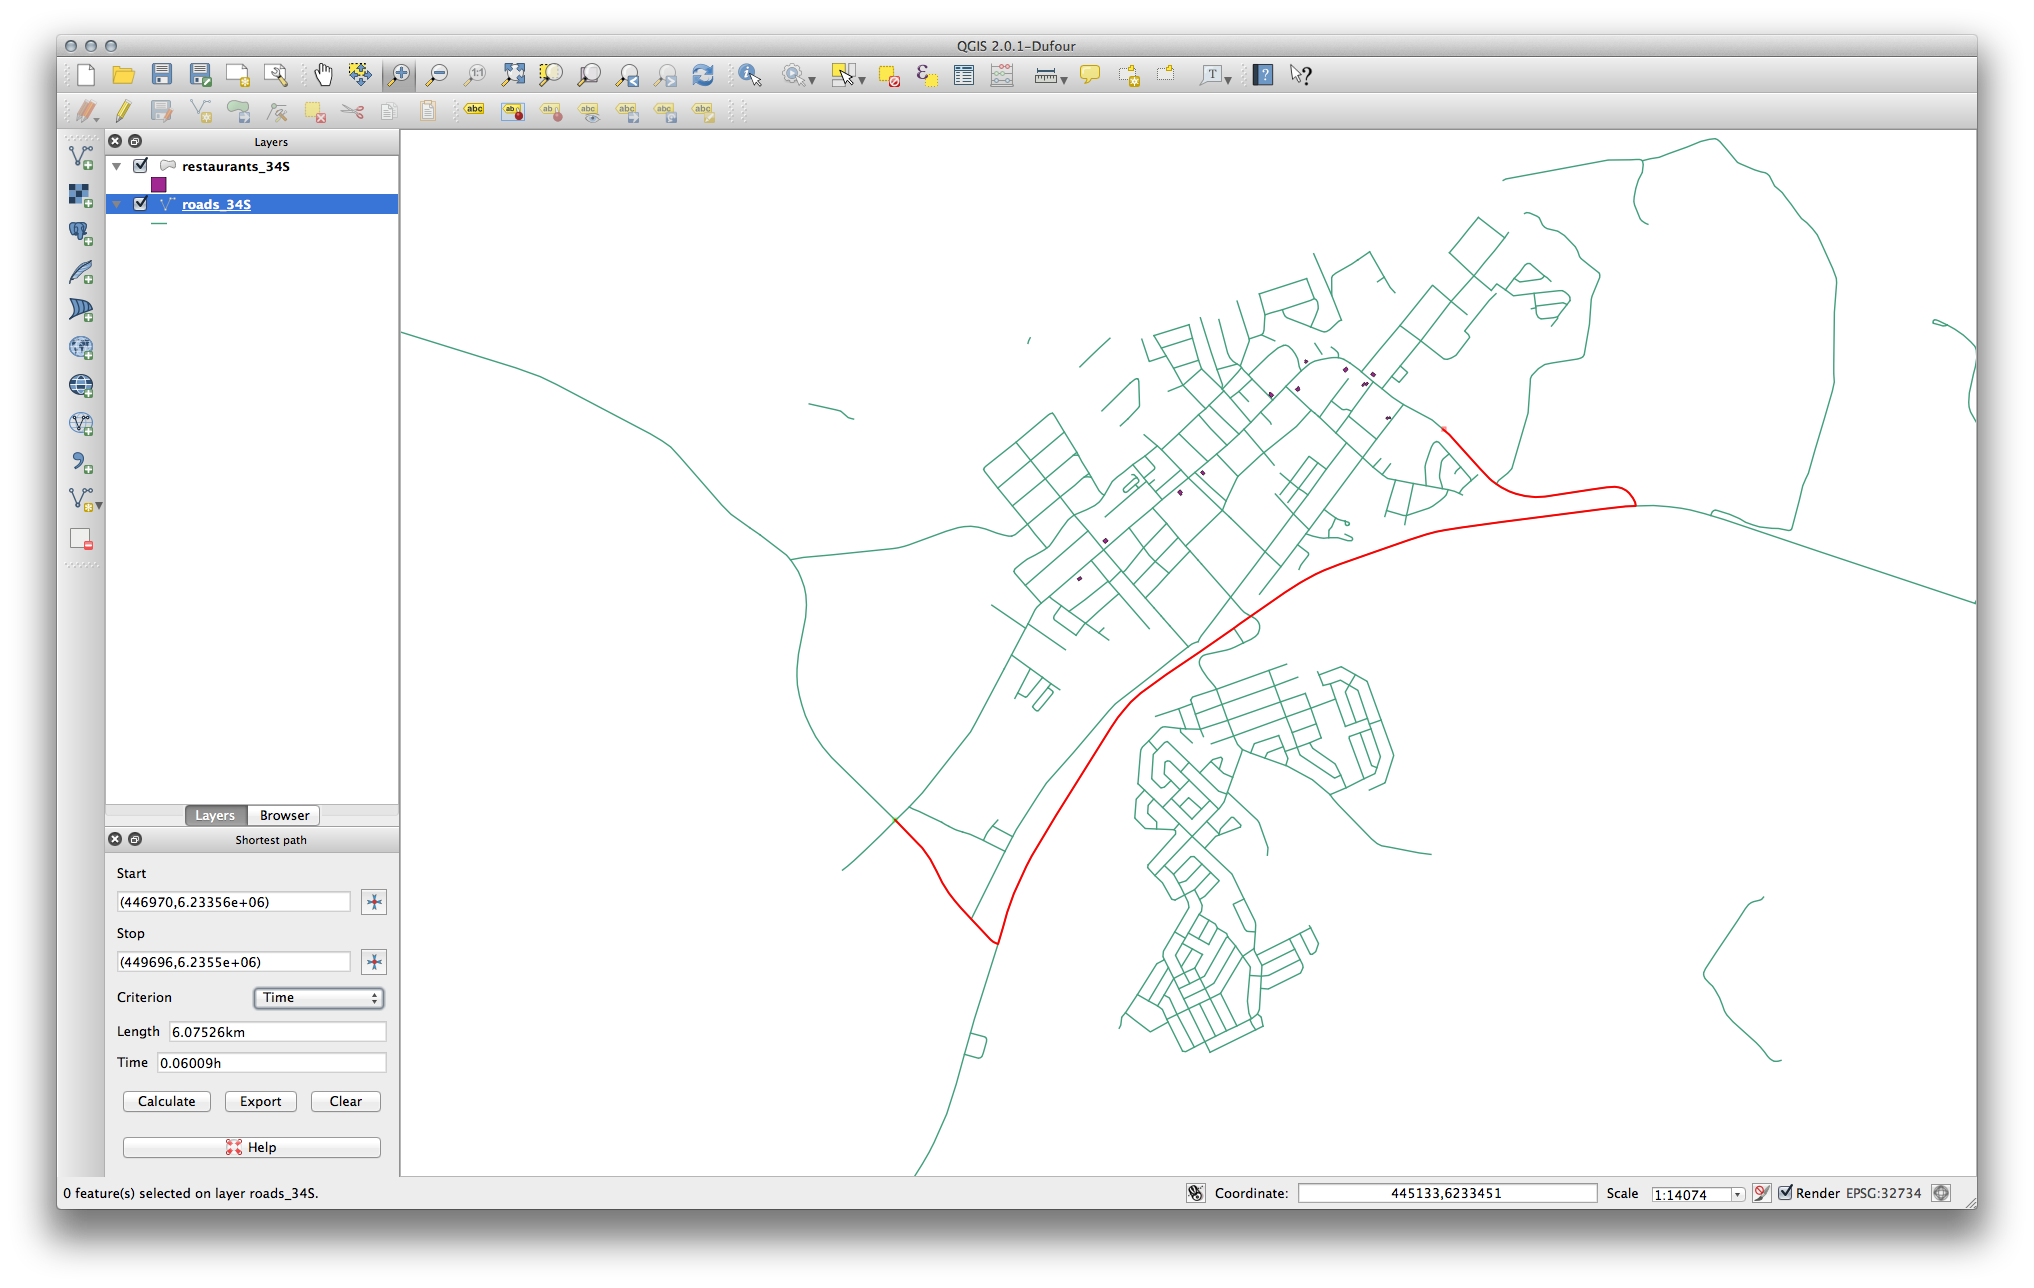
You can switch back and forth between these criteria, recalculating each time, and note the changes in the Length and Time taken. Remember that the assumption being made to arrive at the time taken to travel a route does not account for acceleration, and assumes that you will be traveling at the speed limit at all times. In a real situation, you may want to split roads into smaller sections and note the average or expected speed in each section, rather than the speed limit.
If, on clicking Calculate, you see an error stating that a path could not be found, make sure that the roads you digitized actually meet each other. If they’re not quite touching, either fix them by modifying the features, or set the Topology tolerance in the plugin’s settings. If they’re passing over each other without intersecting, use the Split features tool to “split” roads at their intersections:

Remember that the Split features tool only works in edit mode on selected features, though!
You might also find that the shortest route is also the quickest if this error is returned.
7.3.5. In Conclusion
Now you know how to use the Road Graph plugin to solve shortest-path problems.
7.3.6. What’s Next?
Next you’ll see how to run spatial statistics algorithms on vector datasets.