Tag: en_gb
[Case Study] Monitoring historic buildings in Derbyshire
Crowdfunding Campaign Completed: QGIS 3D for Open Source Digital Twins
[Blog] Mergin Maps gets sketchy
[Replay] Webinar “Security Project for QGIS”
Do you deal with sensitive geospatial data ? Are you concerned by cybersecurity threats ?
Oslandia and partners ( e.g. OPENGIS.ch) launched the « Security Project for QGIS » : a mutualized funding effort to increase QGIS cybersecurity.
️During this webinar, Vincent Picavet first presented the context of the project : new regulations are coming ( CRA, NIS2 ), cyberattacks increase, software see a growing complexity, and QGIS legacy makes it difficult to increase security … and its benefits !
You can access the replay for free, after filling in a quick survey.
Do not hesitate to pledge for the project on https://oslandia.com/en/security-project-for-qgis/, and contact us for any question qgis+security@oslandia.com !
Feedback of the QGIS-fr 2025 Users Meeting
QGIS User Conf 2025 videos have landed!
The QGISUC2025 team has done an awesome job recording and editing the conference presentations. All “presentation” type talks where the presenter has accepted to be published are now available in a dedicated list on the QGIS Youtube channel.
I also had the pleasure of presenting our Trajectools plugin and you can see this talk here:
Thank you to all the organizers, speakers, and participants for the great time!
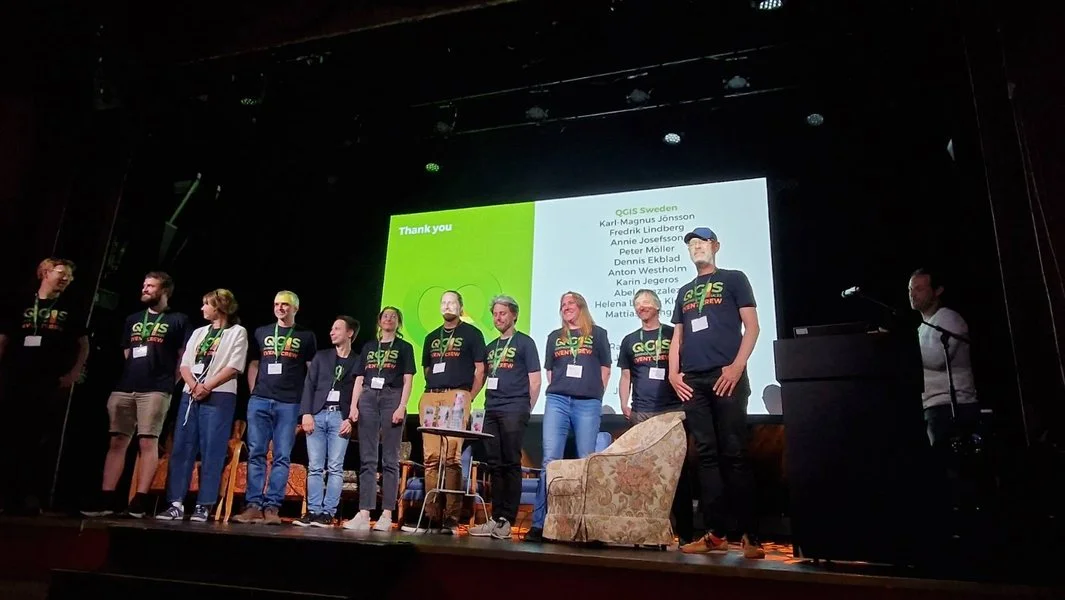
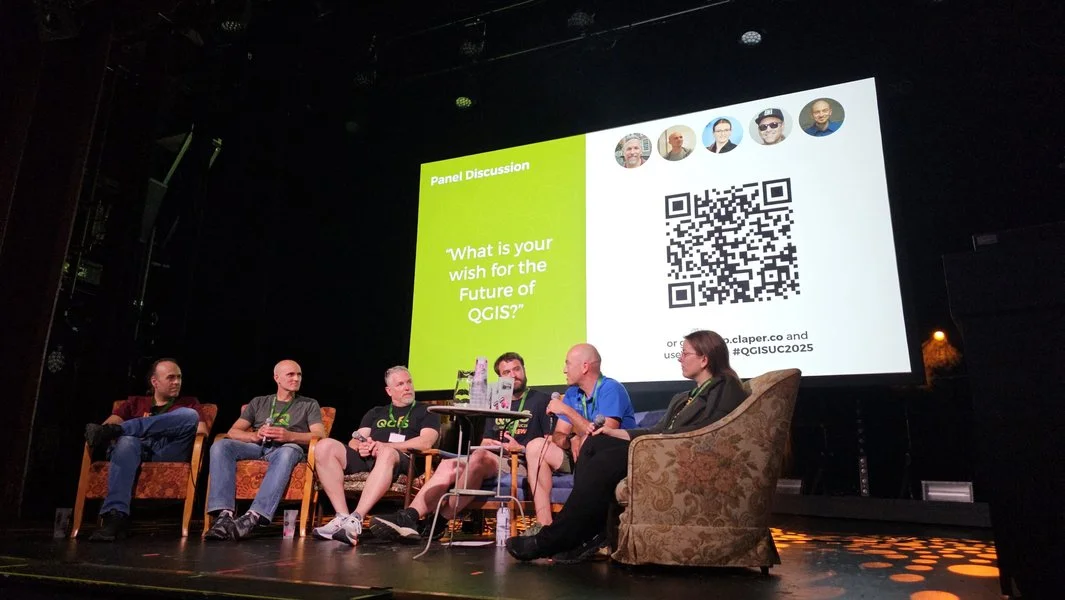
Celebrating community, innovation, and open-source GIS in Sweden – AKA the QGIS user conference 2025
It was such a pleasure to be part of the QGIS User Conference 2025 in Norrköping! The event was extremely well organised — a big thank you to the amazing local team for pulling it all together so smoothly. Personally, it felt special to be back in Sweden, almost 20 years after my Uppsala university days. I truly enjoyed giving the opening keynote and sharing the latest from the QGIS project — and of course, showcasing all the QField greatness we’ve been working so hard on 


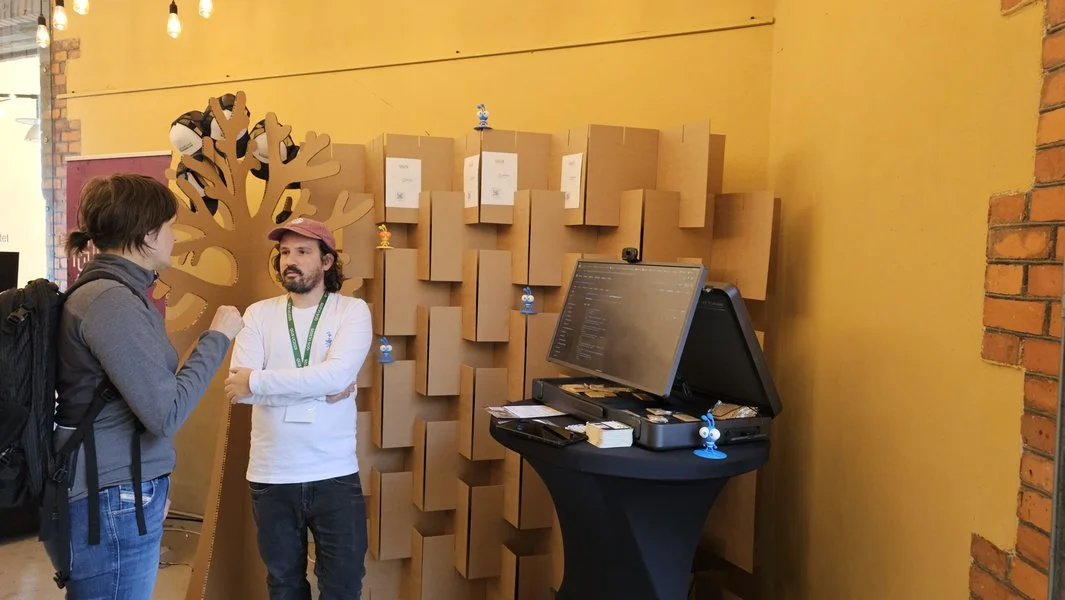
 Talks & Presentations
 QGIS.org updates
As Chair of the QGIS.org association, I had the opportunity to share recent updates from the QGIS community. I spoke about ongoing development efforts, community growth, funding initiatives, and collaborations that help keep the project moving forward.
The focus was on the people who make QGIS possible — contributors, sponsors, local user groups, and everyday users — and how their involvement continues to shape the project’s direction and ensure its long-term sustainability.
 Slides here (unfortunately keynotes and workshops were not recorded)
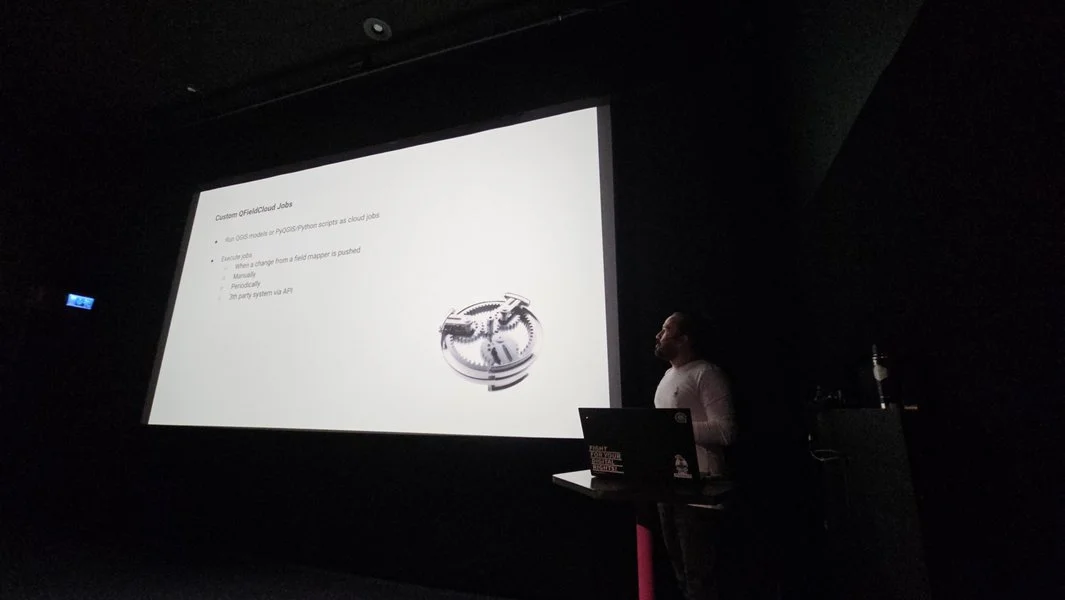
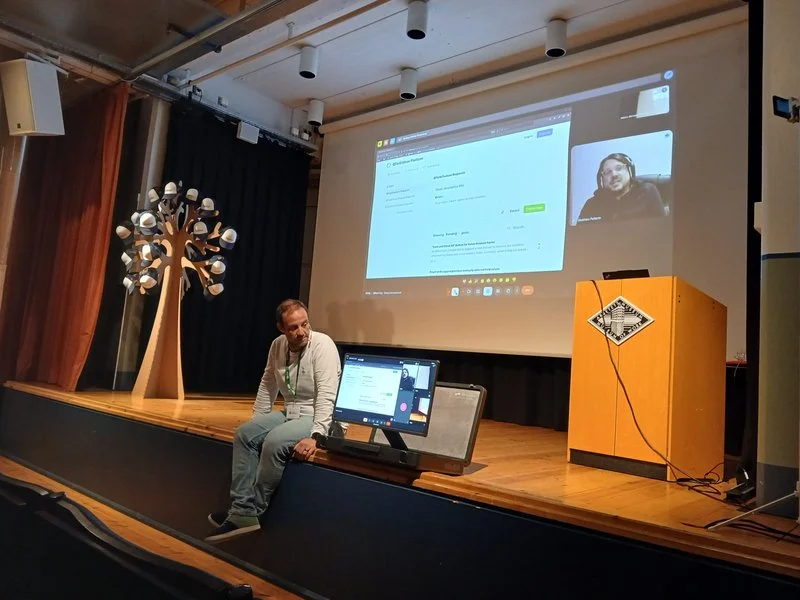
 Extending QFieldCloud – Ideas and Practical Examples
In this talk, Michael, one of our Full stack GeoNinja and Web Cartography teacher, explained how QFieldCloud can be extended by integrating additional Django apps. This allowed, for example, the generation of QField projects, reacting to events from fieldwork, adding new websites and APIs, and executing entire QGIS models as QFieldCloud jobs.
After a technical introduction, various practical examples were explored. It was shown how OpenStreetMap data can be fully automated to download offline-capable QField projects. Attendees got inspired by how an own WebGIS is brought to life in QFieldCloud using OpenLayers. Furthermore, he demonstrated how remote sensing data can be downloaded, analysed in a QGIS pipeline, and the results made available in QField projects. Finally, the discussion focused on how these capabilities can be optimally used in combination with QField plugins.
 SIGNALO: An Open-Source Solution for Mapping Road Signs in QGIS
Presented by Denis, our Industry Solution Team Lead, SIGNALO is a QGIS-based solution for mapping road signs, powered by a PostGIS database. It addresses the challenge of representing vertical data on maps while ensuring compliance with Swiss norms, yet remains highly customizable for use at local, regional, or national levels. Moreover, the flexible design allows for easy adaptation to other countries.
In this talk, Denis explored both the technical foundations of the project and the organizational strategies that enable its open-source development.
 1.5 Million Reasons to Use QField
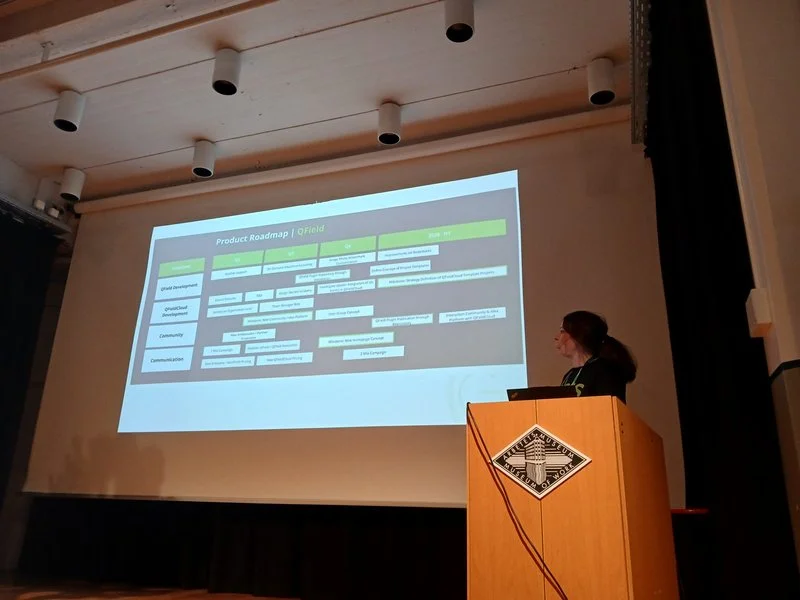
In this talk, I shared our vision for the future of QField — the world’s most popular open-source mobile GIS solution. With over 1.4 million downloads and 500,000 active users, QField is making a real difference for fieldwork around the globe.
I spoke about where we’re headed next, what new features are coming, and how we at OPENGIS.ch are working to empower professionals across all sectors with powerful, flexible, and open tools for mobile geospatial workflows.
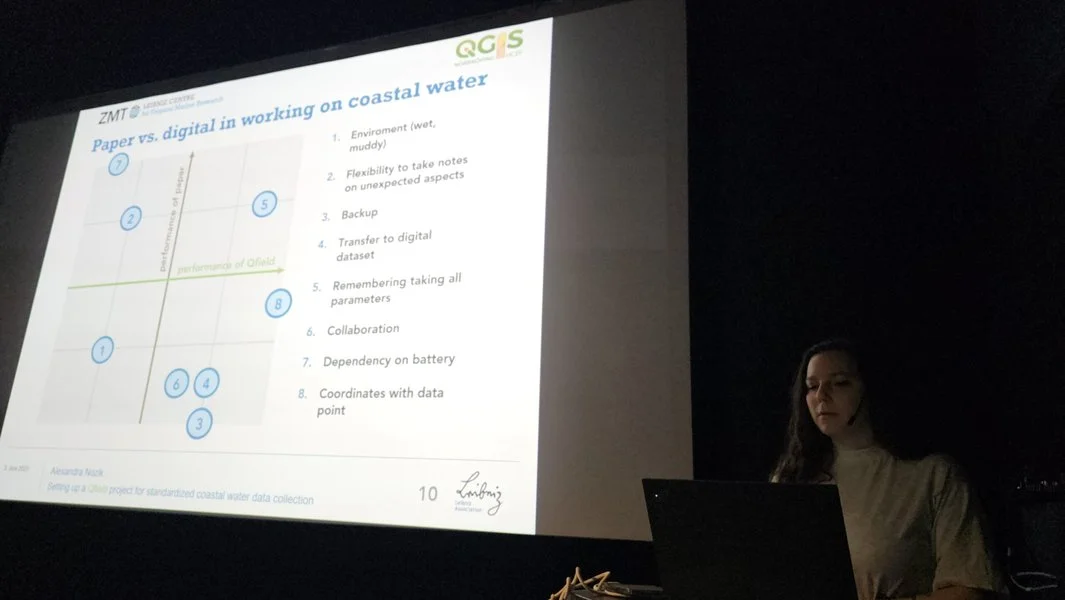
 Standardizing Groundwater Data Collection with QField
We were excited to see Alexandra Nozik from the Leibniz Centre for Tropical Marine Research (ZMT) present her work on a QField project designed to standardize groundwater data collection in remote tropical regions. The setup uses QGIS layers, predefined parameters, and metadata standards to ensure high-quality, consistent field data. Integrated with QFieldCloud, the workflow improves data accuracy, reduces data loss, and enables real-time collaboration. The project will be published on GitHub as a ready-to-use package, supporting reliable and comparable groundwater data collection across the scientific community.
 QField and QFieldCloud – seamless fieldwork for QGIS
In this workshop, Zsanett, QField Product Manager, went through the complete fieldwork process: setting up a QGIS project, publishing the project via QFieldCloud, collecting data via the QField mobile app and synchronising the field data back to your main dataset in the office. QField works on top of QGIS and allows users to set up maps and forms in QGIS on their workstation and deploy them in the field. QField uses QGIS’s data providers (OGR, GDAL, PostGIS and others) and supports most common file formats. QField combines a minimal design with sophisticated technology that allows intuitive viewing and editing of data. QField’s map rendering is supported by the QGIS rendering engine, so the results are identical and the full range of styling options available on the desktop is available. Editing forms in QField respect the QGIS configuration and are optimised for touch interaction. QFieldCloud makes field collaboration much easier. Participants learned about configuring users with different rights, collecting offline and online data, and synchronizing field data and QGIS project data.
 Our first international QField Day
On June 4th, the first international QField Day took place in Norrköping, right after the QGIS User Conference. This free half-day event was dedicated to QField, QFieldCloud, and the mobile GIS community, bringing together users, contributors, and developers for an afternoon of field-tested workflows, live demos, community stories, and open discussions. It was a great opportunity to connect, exchange ideas, and explore the future of mobile geospatial tools in the open-source ecosystem.
Definitely not our last one. 

 Supporting Open Source
We were proud to support QGIS UC25 in Norrköping, Sweden, as Platinum Sponsors — reaffirming our commitment to the open-source geospatial community and the continued growth of the QGIS ecosystem.
 Looking Ahead
We’re already looking forward to the next gathering — QGIS UC26 will take place in Switzerland  !
!
After the conference, I joined the contributor meeting along with four QGIS developers from OPENGIS.ch. It was a fantastic chance to collaborate in person, help shape the future of QGIS, and reconnect with old friends from the community.


QGIS 3.44 Launches 3D Globe View with Enhanced Performance
Crowdfunding QGIS 3D: Support Open Source Digital Twins
Using Data Defined Overrides in QGIS
Using Data Defined Overrides are a powerful tool in QGIS, but I’ve got the impression that too little people use this feature. So in this blog post you can learn what they are and I’ll show you a simple example of how to use them. You will notice this blog post is pretty long, but that doesn’t mean Data Defined Overrides are difficult, they just have loads of options and I wanted to show you every step I took to use them.
What are Data Defined Overrides?
In QGIS you can use data from a layer or an expression to change the value of a setting in a layer for that specific map object. This means that a setting is dynamically changed based on a value in the attribute table of that object or a value that is generated using an expression. In other words, if you use a Data Defined Override, the manually entered setting is ignored, and instead something else is used.
Where do I find these Data Defined Overrides?
If you see a button like this one: ![]() next to a symbology or label setting, then that’s a setting you can change using Data Defined Overrides. You will notice this button is available all over the place in the symbology and label settings of a layer.
next to a symbology or label setting, then that’s a setting you can change using Data Defined Overrides. You will notice this button is available all over the place in the symbology and label settings of a layer.
How to use Data Defined Overrides?
If you click on a ![]() button. A menu will open:
button. A menu will open:
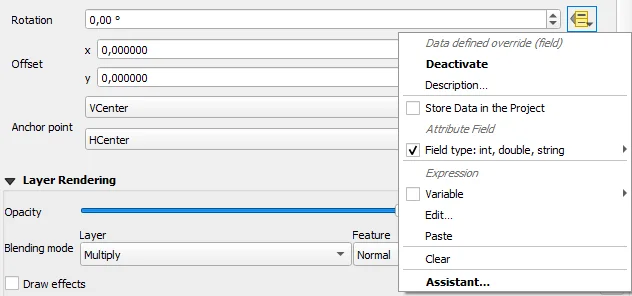
In this menu you will find different ways to enter a Data Defined Override. The first, and maybe simplest way is to select “Field” in this menu. This will show a list of fields that can be used. When you select one of the available fields, the content for that field will be used as a setting.
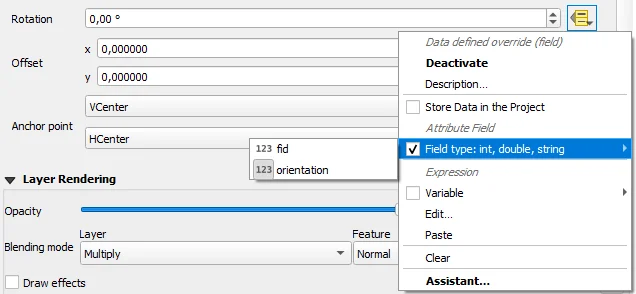
Another simple way to create a Data Defined Overrides is the Assistant.
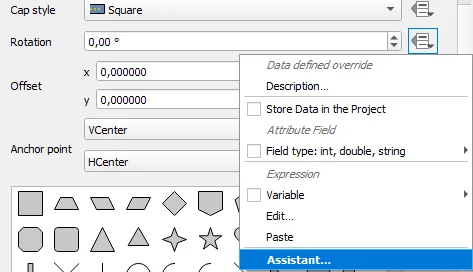
If you click on that option, a new window will open:
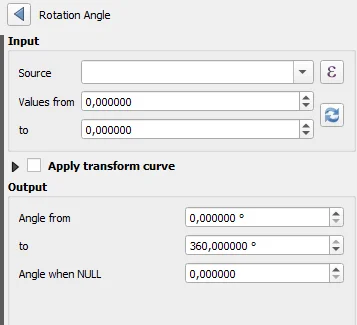
In that window you get information on what kind of value QGIS expects for this setting. There is also the option to select a field or use the expression editor using the ![]() button in this settings window. In the example above you see the Assistant for the Rotation setting. And you will see it has a lot more options than just the field. The content of this Assistant window will be different depending on the setting you want to override.
button in this settings window. In the example above you see the Assistant for the Rotation setting. And you will see it has a lot more options than just the field. The content of this Assistant window will be different depending on the setting you want to override.
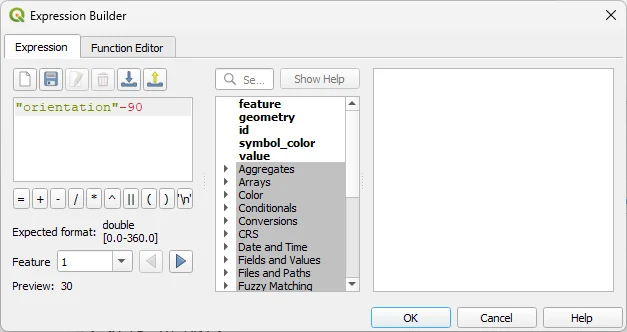
Another way to use expressions to create Data Defined Overrides, is selecting “Edit” in the main Data Defined Override menu. This option will also allow you to edit the expression afterwards, if you want to change it.
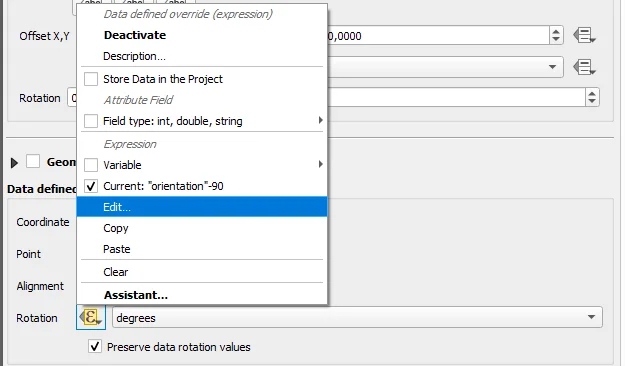
In the Expression Builder you can use all possibilities the expressions give you, but you have to make sure the result of your expression is a value the setting expects. The expected format is shown under the expression input box. The preview of the expressions result is a good way to check if the result are compatible with the expected format.
The button turned yellow!
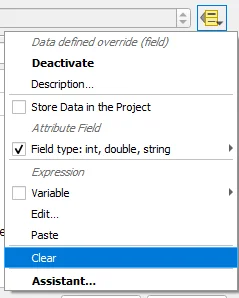
If a Data Defined Override is used the ![]() turns into
turns into ![]() . That way QGIS notifies you that the setting itself is ignored by the program, but instead the Data Defined Override is used. If you want disable the Data Defined Override, you can go to edit and remove the expression or you can select the option “Clear” after you pressed the
. That way QGIS notifies you that the setting itself is ignored by the program, but instead the Data Defined Override is used. If you want disable the Data Defined Override, you can go to edit and remove the expression or you can select the option “Clear” after you pressed the ![]() button.
button.
What can I enter into a Data Defined Override?
The answer to that question depends on the setting you want to override. The Expression builder or the Assistant will probably make it clear what kind of value from a field or expression is expected. For example:
- The setting rotation will expect a “double” value between 0 and 360. So 122.5 would be a valid value.
- An opacity setting will expect an “integer” value between 0 and 100. So 50 would be a valid value, but 50.1 wouldn’t.
- A color expects a “text” in one of the following kinds of forms:
- [r,g,b,a] where r is red, g is green, b is blue and a is the alpha value. Each of these is an integer value between 0 and 255. The entire setting without the square brackets must be a text. So for example ‘250,25,100,200’ ▮ including the single quotes would be a valid color setting.
- Hex color codes in the forms #AARRGGBB or #RRGGBB as a text value like they are used in HTML and CSS are possible to define a color. So for example ‘#FF5000’ ▮ is a possible color.
- A third way to define a color is to use the name of the color. A list of color names can be found on https://developer.mozilla.org/en-US/docs/Web/CSS/named-color. So for example ‘skyblue’ ▮ is a possible color.
Units like degrees or percentages are not part of the value. QGIS will assume these units based on the setting you want to override. Sometimes the units are a separate setting, and so for a width you first set the unit setting and for the main width setting you can use the Data Defined Override.
A simple example
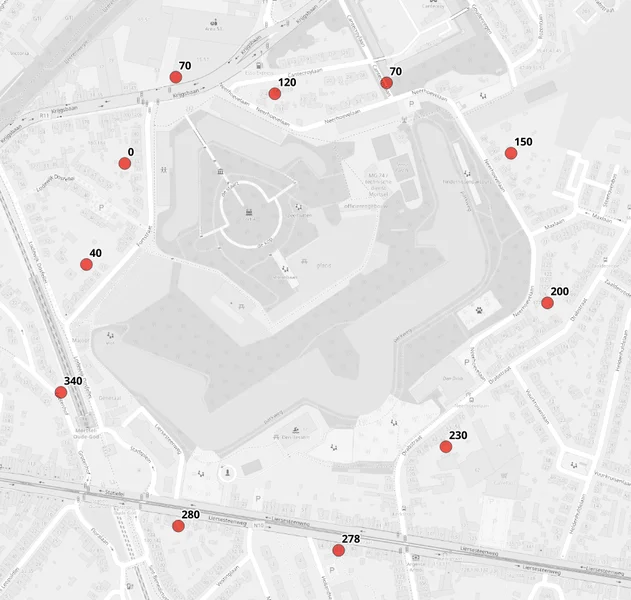
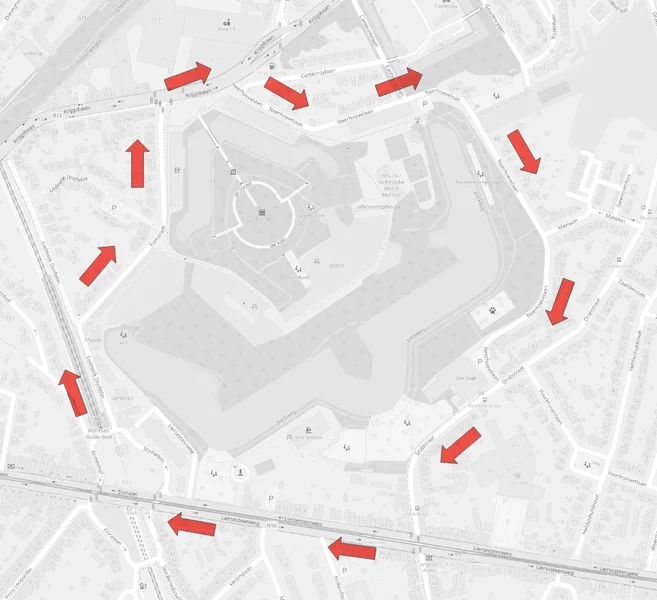
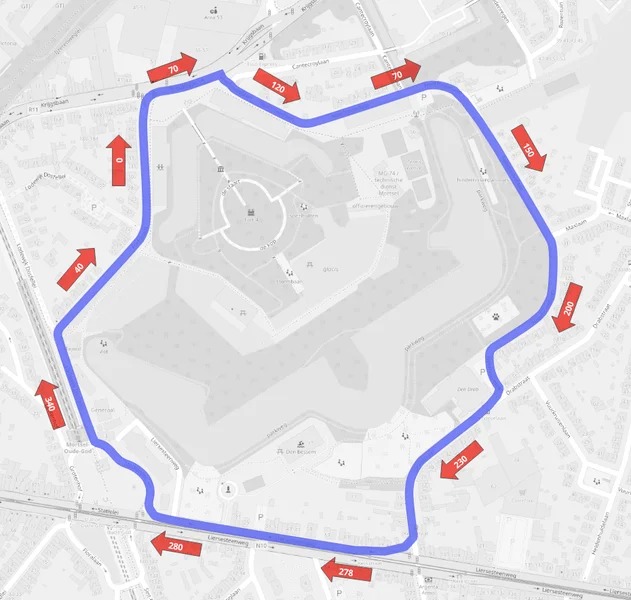
To make Data Defined Overrides easier to understand I’ll show it with this simple example below. We start with a simple point layer. In this example the points are the locations of arrows we want to place along a route. We want the arrows to be rotated so they are aligned along the route. To accomplish this I have added a field called “rotation” and for each point I have entered a number into that field that has the rotation value (between 0° and 360°) of each arrow.

On the map below you can see each point labelled with it’s rotation value.
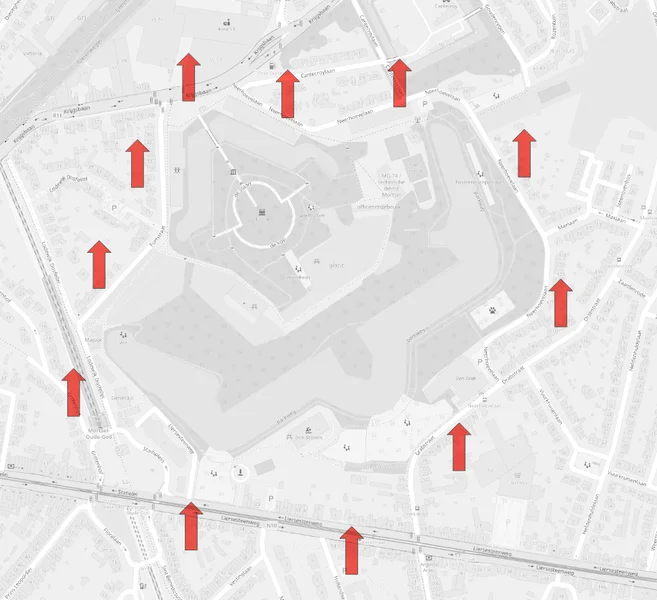
After that we will change the symbol of the points to arrows. You can style them anyway you want, but I chose to make them as a simple marker with a simple red arrows. At this moment all arrows will point up.
To change the rotation we will now use Data Defined Overrides. First we have to click on the ![]() button next to the rotation setting. There I click on the option “Field”, and select the field “orientation” I previously created in my shapefile.
button next to the rotation setting. There I click on the option “Field”, and select the field “orientation” I previously created in my shapefile.

After I did that, you will see that each arrow is rotated based on its value in the field “rotation” in my shapefile.
After that I also added the route as a separate blue layer and added the field “rotation” also as a label on top of the arrows. I also used Data Defined Override for the rotation setting of the label and that results in the map below.
Another example
As said before you can find Data Defined Overrides in lots of settings. In the example below I used the same “rotation” setting on the field “Size”. Ans I used “Meters at scale” as unit for Size.

To conclude
I hope this explanation helps you understand that Data Defined Overrides are a powerful tool to create symbologies. I used the a lot in my examples for Geometry Generators you can find on Codeberg, because those two QGIS functionalities make a great combination. But more about that will follow in one of the next posts on this blog.
Please tell about how and why you use Data Defined Overrides in QGIS in the comments below. I’d love to hear about other use cases.